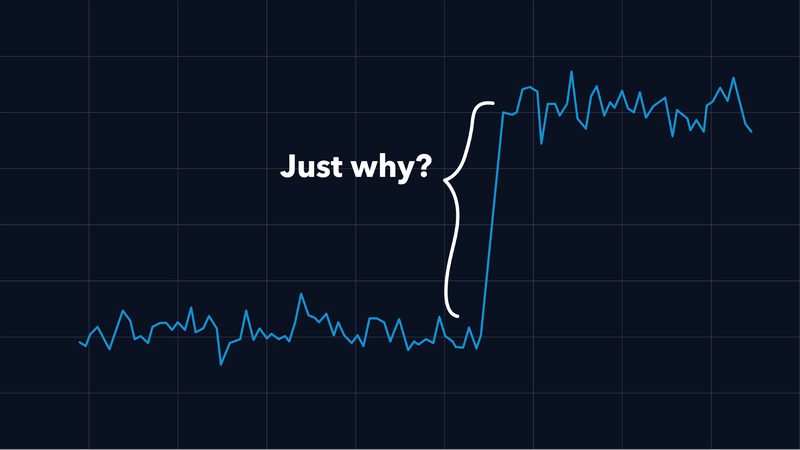
Metrics are one of the main building blocks in the topic of observability.
Hence, we have a lot of metrics within our applications and especially for the connections between our applications. Every outgoing request has its latency measured and we also record the sizes of the request and the response. These numbers are collected in histograms and based on that data, in our Grafana graphs, we create corresponding graphs that show us e.g. the median size of request- and response payloads or the 99th percentile of call durations.


Follow us on