At trivago we love hotels above everything else, but we also like metrics, we love to measure everything, compare, decide, improve and then rinse and repeat. In this blog entry we are going to describe our experience with InfluxDB, a time series database that we are using to store some real time metrics.
The setup together with Grafana and Collectd is quite straight forward. InfluxDB is written in golang and has no dependencies. Collectd is a light agent written in C with many plugins to collect all kind of metrics. Grafana is an angularJS-based dashboard and graph editor. We use the Graphite API to send the data over TCP directly to InfluxDB from the Collectd clients installed in the different servers. We added a Varnish cache in front of InfluxDB to improve queries performance and reduce load. It is particularly helpful when you have a heavy list of series as we do.
The database is running in a stand alone node using Debian GNU/Linux with 64GB RAM, 32xCPU and 3TB storage. We haven’t set up yet clustering because of issues with the current Raft implementation in InfluxDB. We use version v0.8.8 with LevelDB as storage engine, Grafana is running v1.9.1 and Collectd v5.4.2
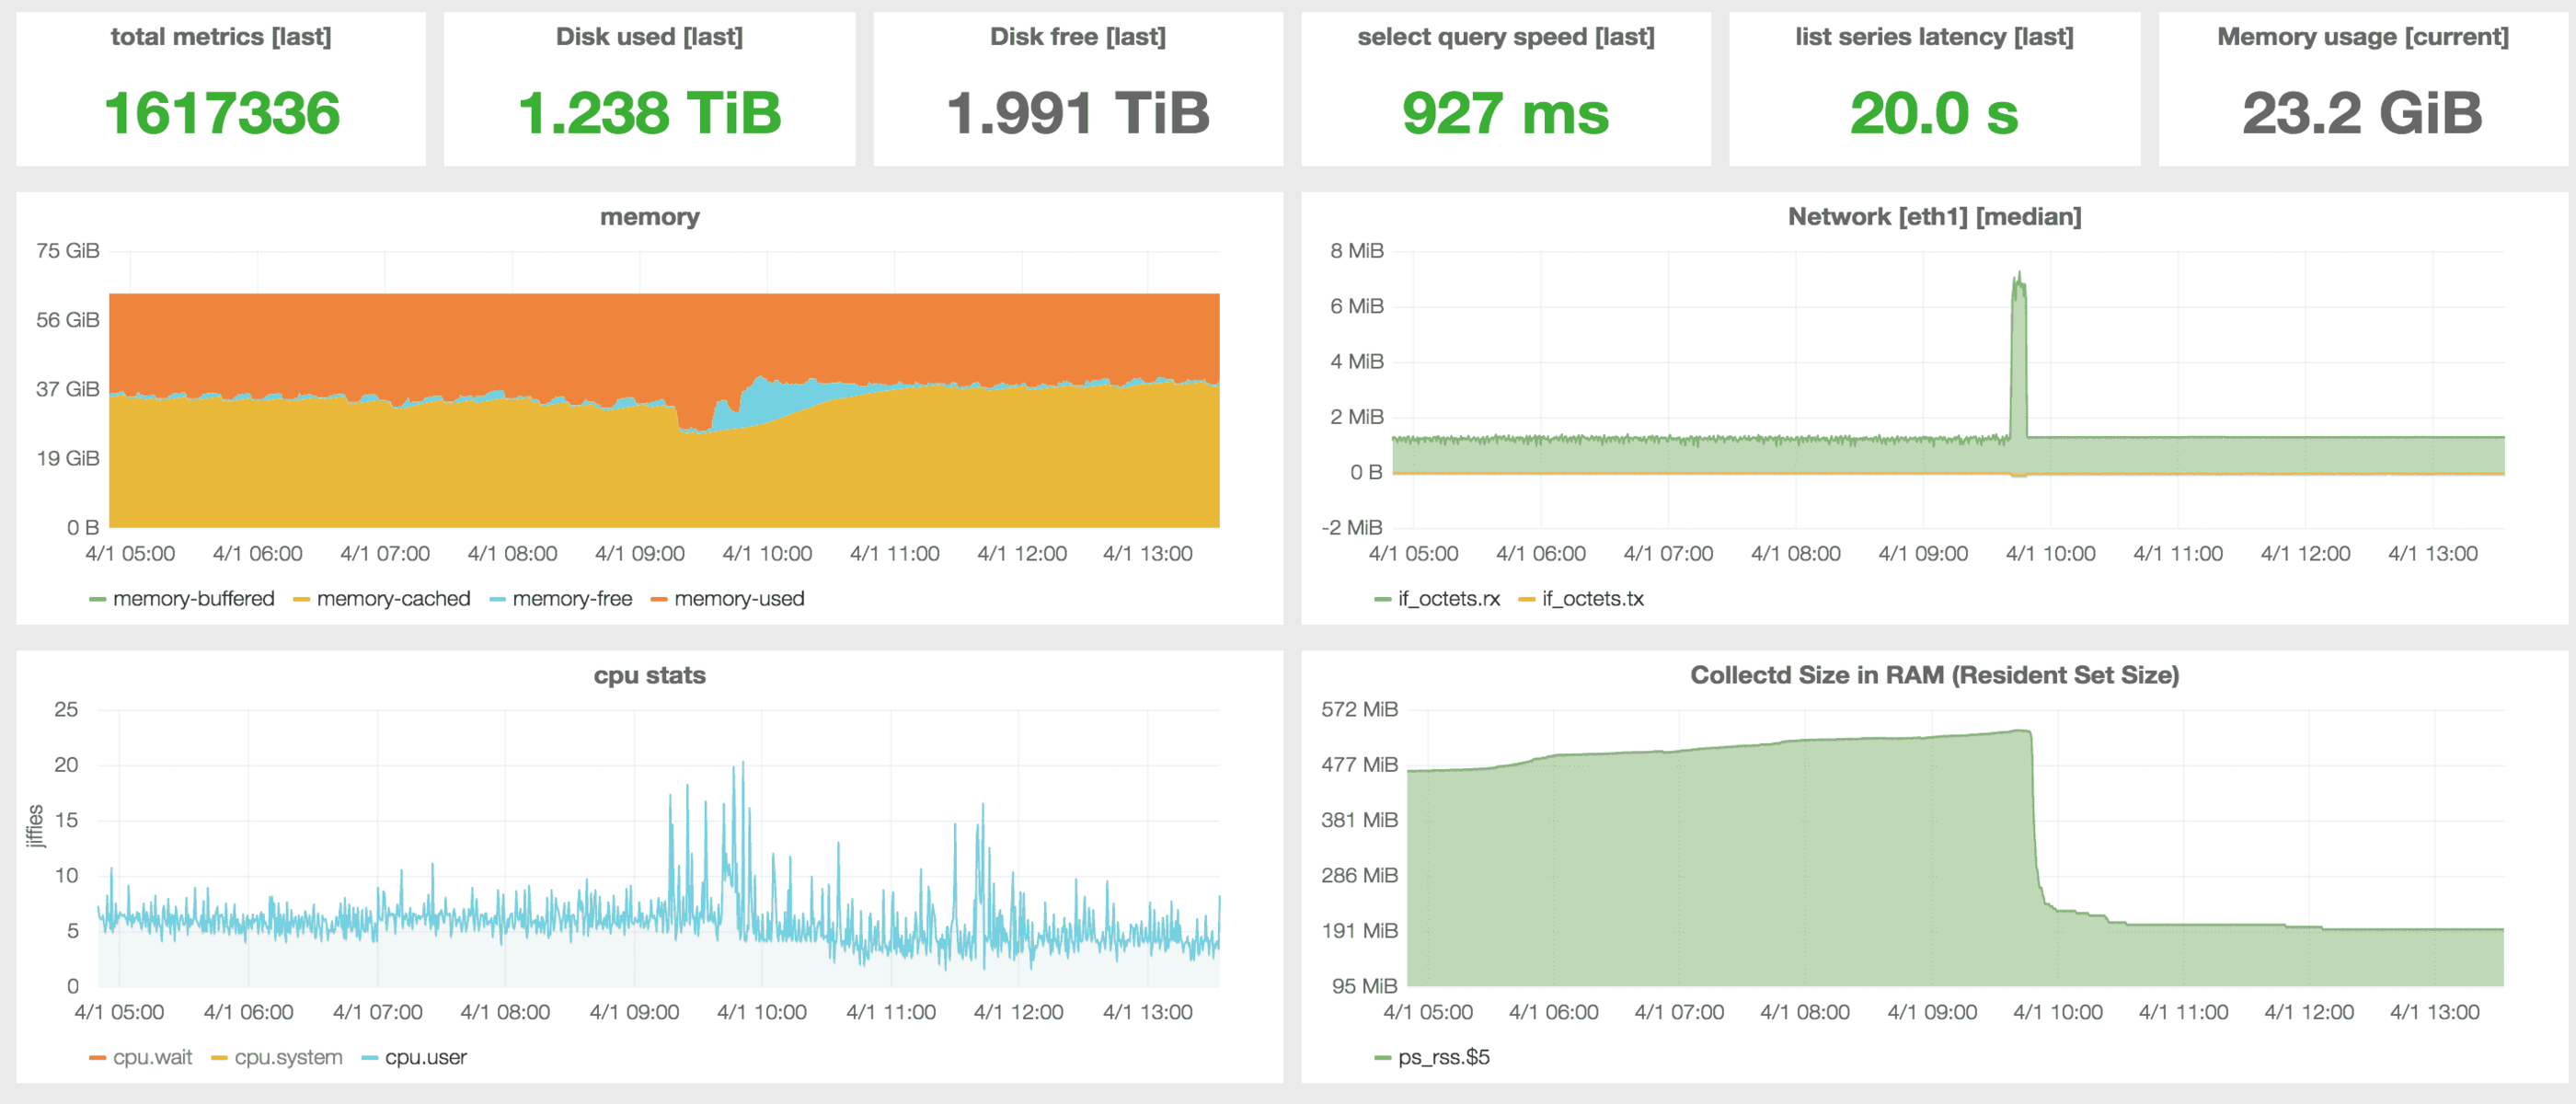
At the moment metrics are being sent from around 150 clients with a 10 seconds interval. InfluxDB is receiving 10K values/sec at a rate of 1.2MB/sec and it has been storing data from more than 1.6 million series during the last 3 months. Some series are no longer in use but they have not been removed because deleting values is still very expensive in InfluxDB and you better don’t do it.
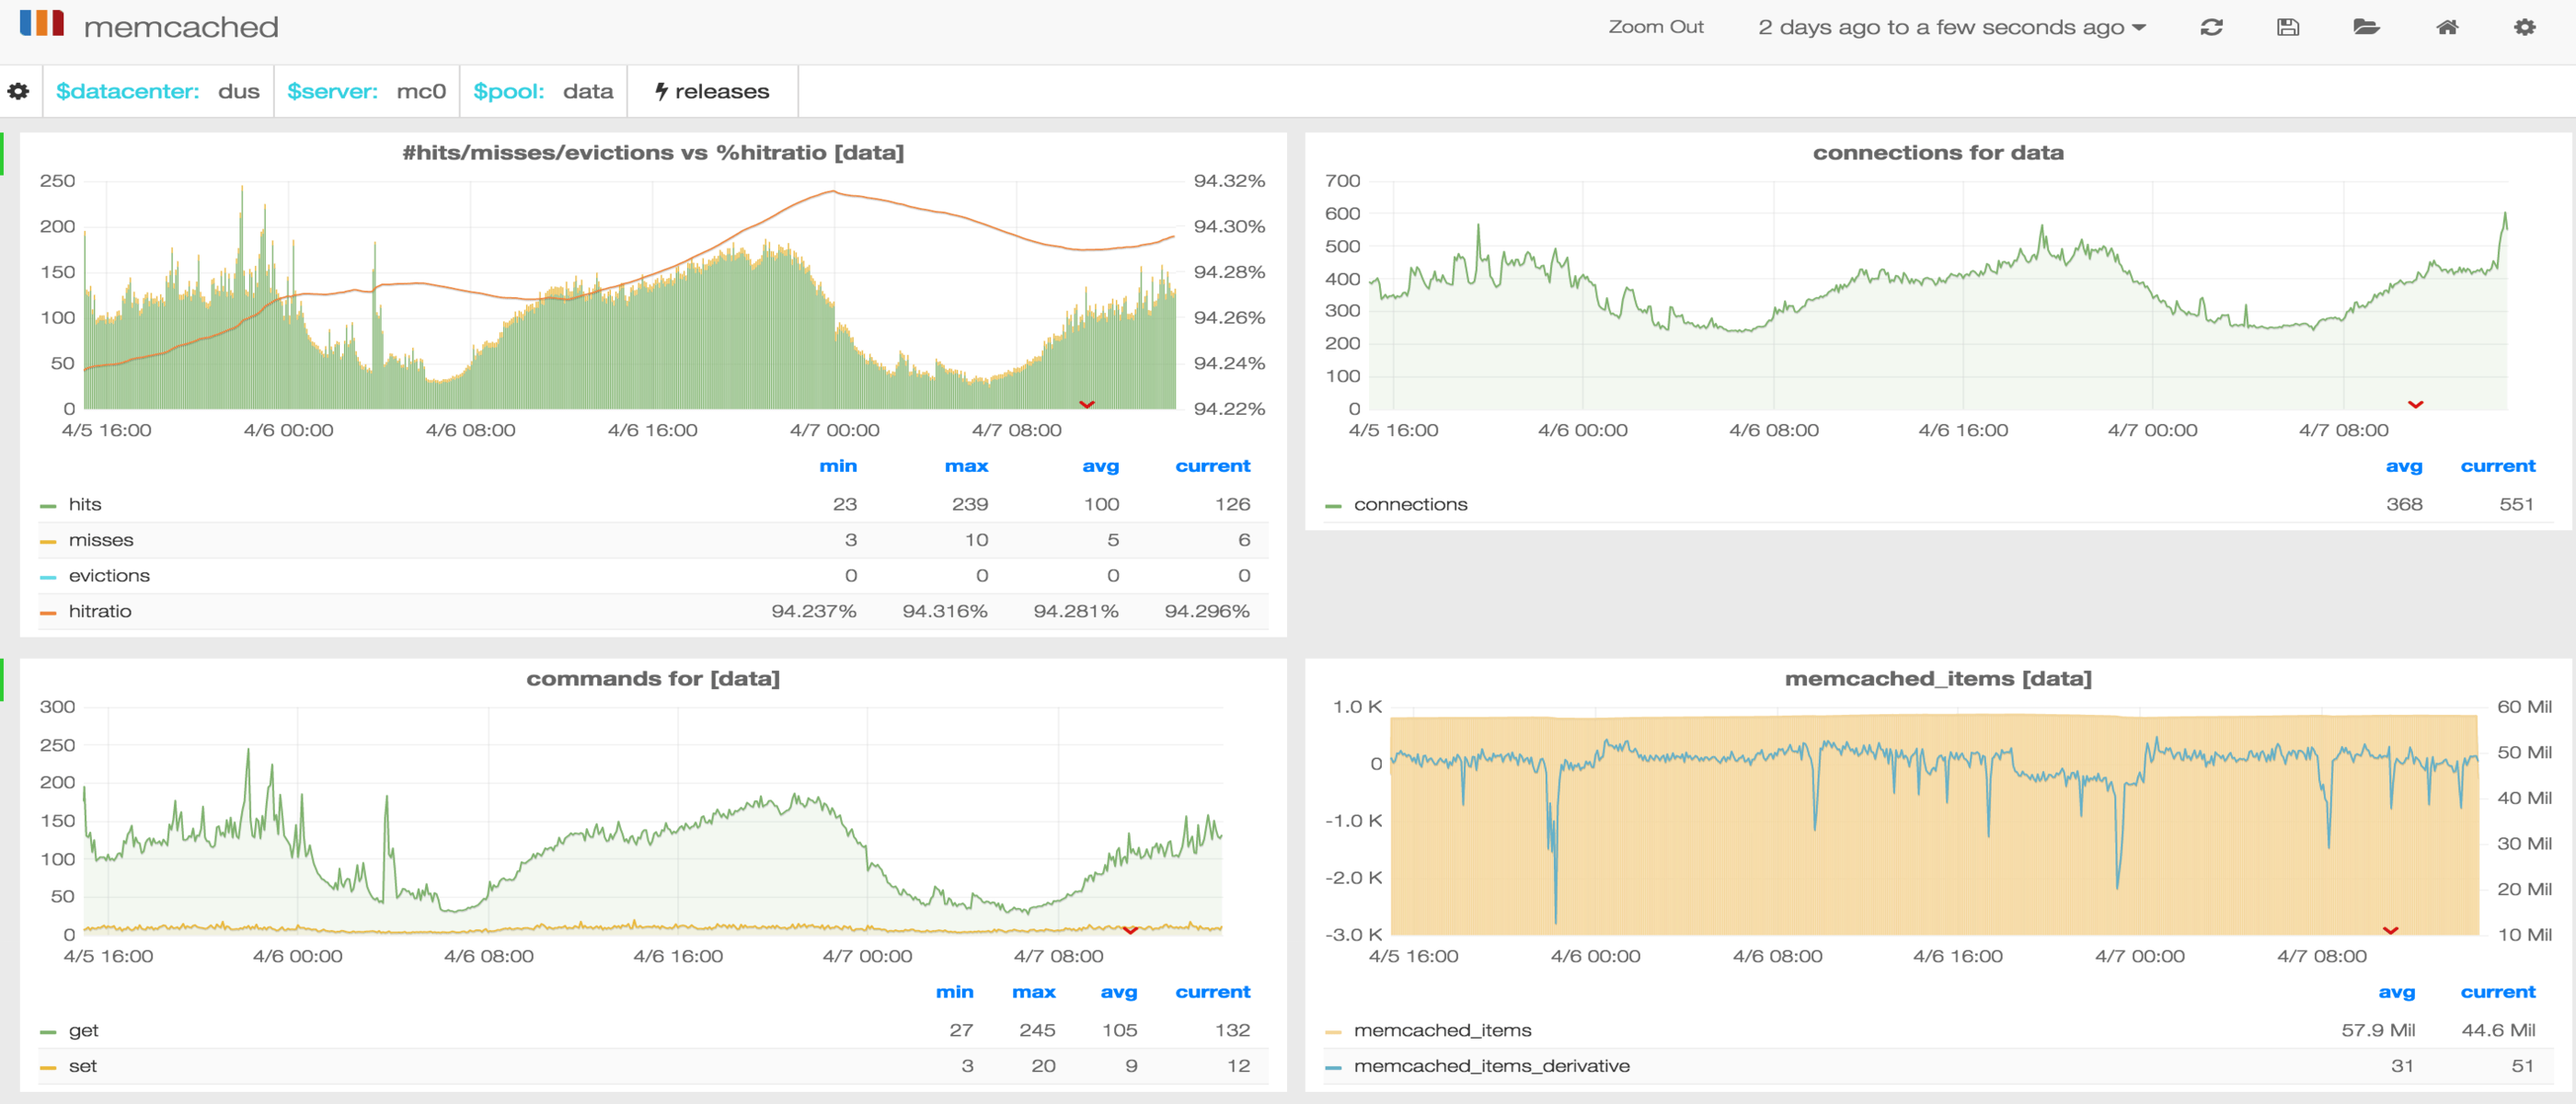
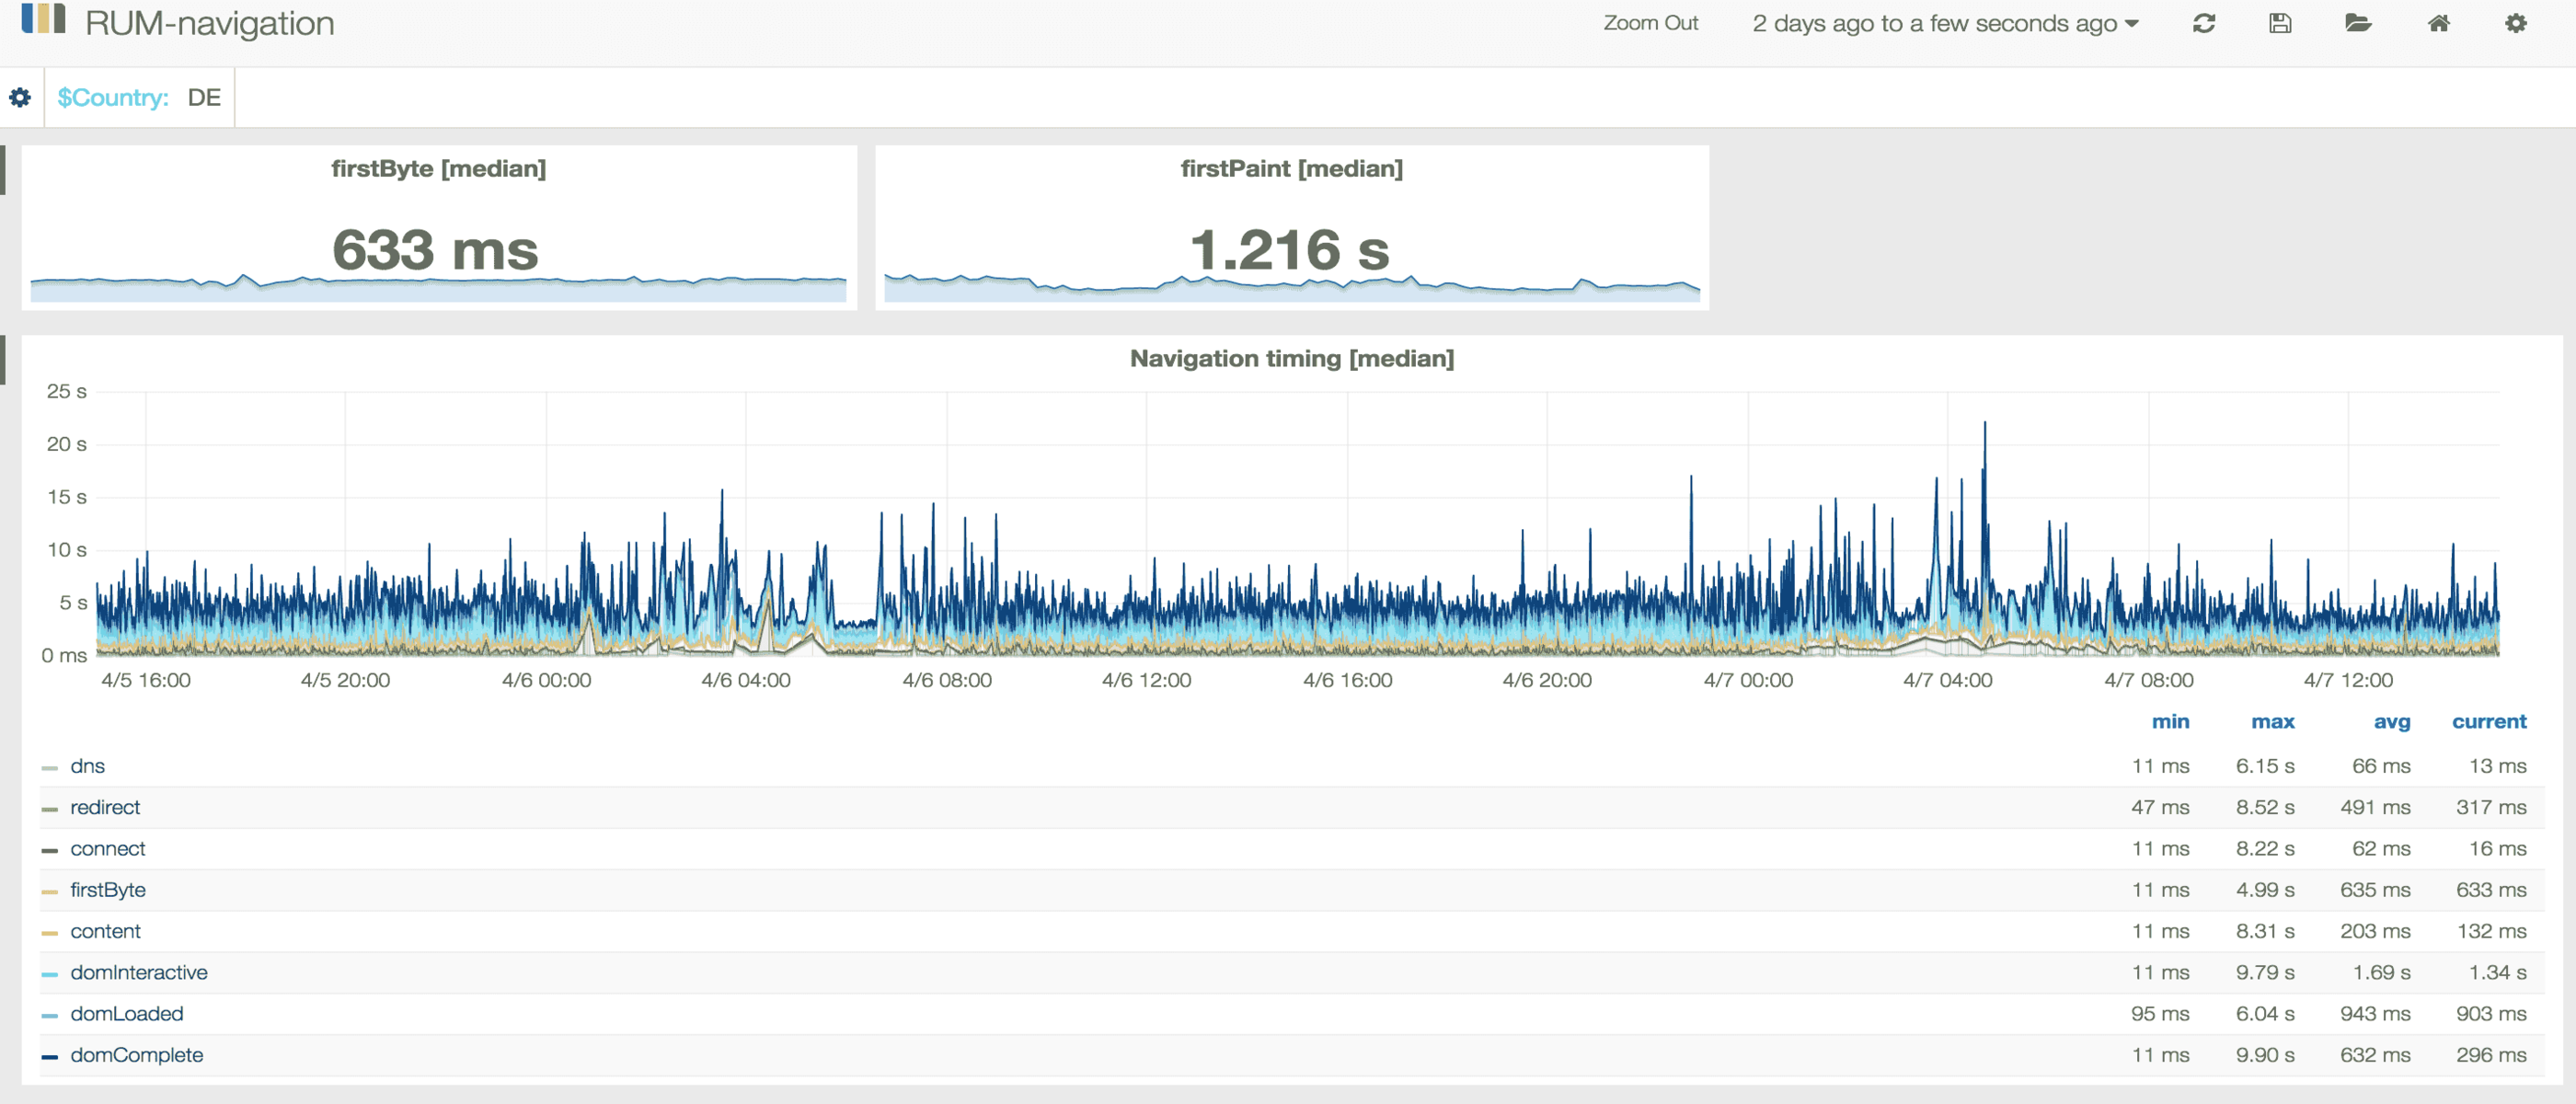
What data do we collect? Metrics from Redis, Memcached, Twemproxy, RabbitMQ, Varnish, Kafka, Real user monitoring metrics, Sitespeed.io, server health, ElasticSearch, as well as PHP and Java application metrics. We also monitor InfluxDB itself with a custom tool written in Python. InfluxDB 0.9 will provide built-in stats.
Defining the series, sharding and continuous queries
As data is indexed only by time we decided not to include any dimensions as columns but rather as part of the series name. The advantage is that using Grafana templates and regular expressions you can have fast dashboards with almost every combination of variables. The disadvantage is that it is difficult to have summarised data. To do so you need to run expensive merge requests across thousands of series and that is slow. That could be mitigated using continuous queries, an InfluxDB feature that let you precompute expensive queries. For instance, this one will merge datapoints from several series into just one
select * from /statsd.latency.rum.DE.search.region.standard.*-average/ into cq.rum.DE.search.region.standard.average backfill(false)Working on the resulting query is then faster, but using continuous queries comes at the cost of memory and CPU usage. They also don’t support regular expresions so you might end up having to create manually a long list of them.
We haven’t used the other types of continuous queries: fanout because we don’t use column values , downsampling because Grafana does a great job already with the auto group by time interval. Ideally InfluxDB should enable Grafana to auto select the right downsampled continuous query to use depending on the time interval length. Otherwise you have to find the right naming and shard allocation for the downsampled series so they don’t interfere with original ones in Grafana.
We use the default shard configuration, shards are defined at the database creation time, new shards can not be added after that and although existing ones can be modified you might end up with data not visible, so you better plan ahead your shard configuration before ingesting data if you are not using the default one.
Storage engine
As already mentioned we are using LevelDB, future versions will run on BoltDB. Version 0.8.6 was shipped with RocksdB as default storage but it had a problem where for some reason it was writing out large logs and never converting them over. On restart it would have to go through and replay them to get back up and during that time metrics won’t be accepted. If that would happen to you, just move the faulty shards to a new InfluxDB installation, replay them and when finished move back the shards to the original server.
Ingesting data
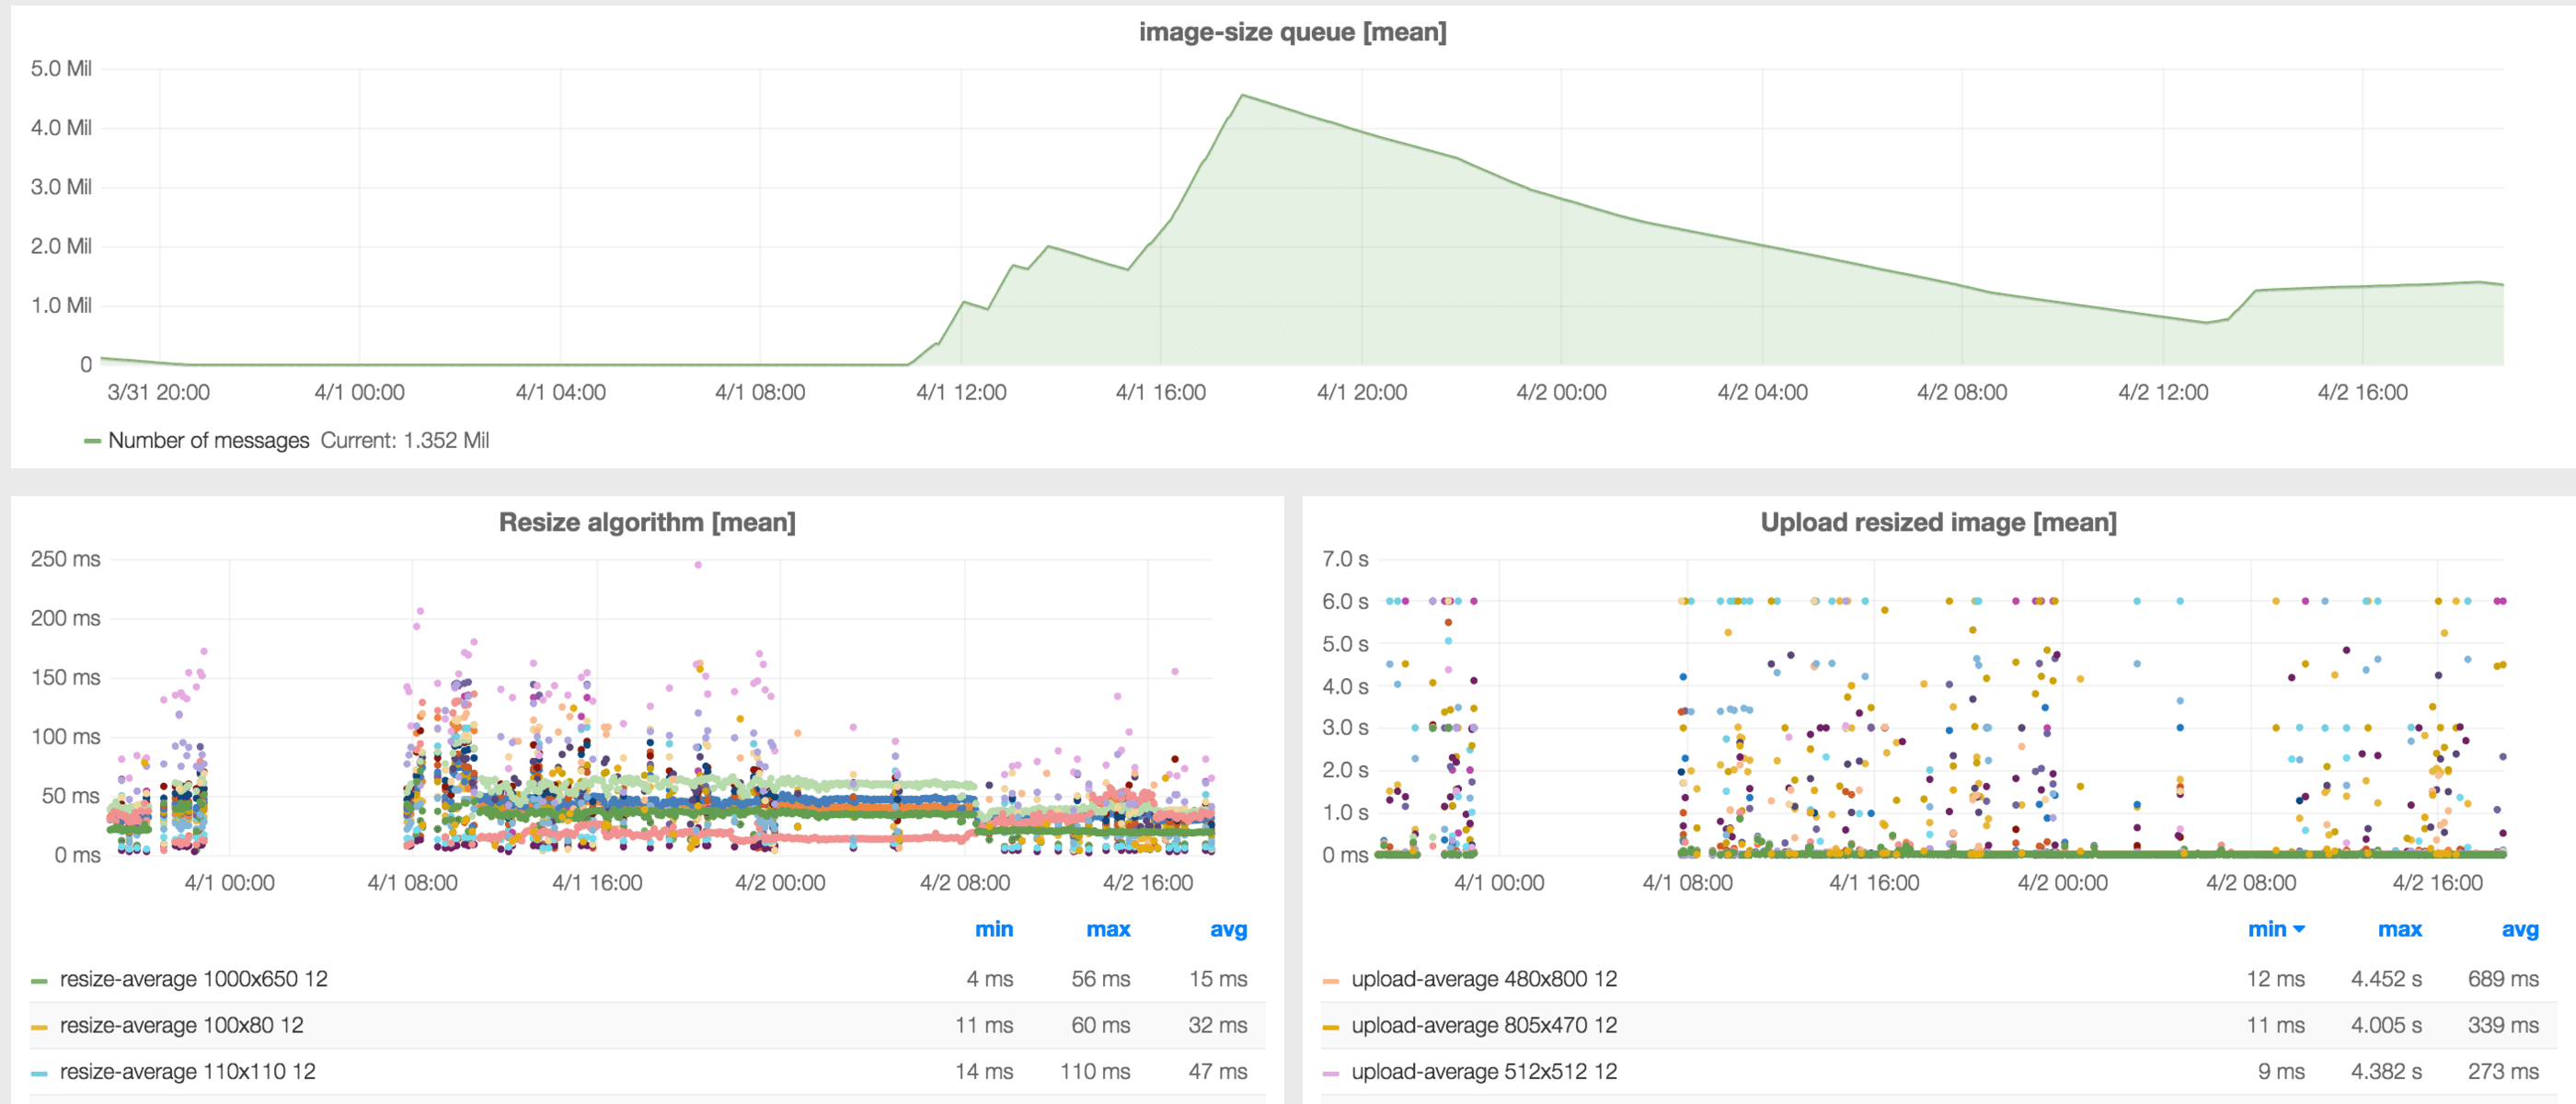
Ingesting data is not very CPU neither memory demanding for InfluxDB. However there are some things that need to be taken into consideration. If you are using continuous queries they might interfere with normal data ingestion. We ended up disabling the ones that we had. The effect can be seen in the following picture:
With continuous queries like the one we described in the section above and the amount of data that we are ingesting, InfluxDB will be sending at some point TCP ZeroWindow packets, a sign that it has trouble processing incoming data fast enough. At the other end Collectd will start buffering and network traffic will be bursty. As soon as the continuous queries are removed, all the backlog is processed and the network traffic is back to normal.
Running low on memory because of expensive queries might also cause data ingestion to slow down and the clients to start buffering or dropping metrics. If using Collectd clients make sure to set WriteQueueLimitHigh in the configuration to prevent growing in memory usage because of buffering.
Querying data
Queries are very memory and CPU hungry when processing long time intervals or when aggregating a lot of data points. With our current amount of data, list series command takes around 20 seconds, and a plain select query (without merge) will take on average around 1 second and there are several per dashboard. To improve query performance we have added Varnish in front of InfluxDB and optimised all regular expresions in Grafana queries to reduce the number of matched series. Some examples here
# escape dots from series names in queries
select median(value) from /kafka\.kafka\d+\.GenericJMX-AllTopics-BytesInPerSec\.gauge-OneMinuteRate/ where $timeFilter group by time($interval) order asc

# use other templating variables when defining new variables to reduce the list of series to return and use wildcards only at the end
/image\.mq-worker0\.statsd\.latency-mqworker\.resize\.$source\.(\w+?)\.resize.*/
With the current version it is neither possible to run queries for predefined time periods like Yesterday, Last Week, Last Month, nor to run comparisons between different time periods. That should be available in next release with the introdcution of Time Zones
Alternatives to the web admin interface
With a big amount of series and datapoints, using a CLI could be an alternative to the InfluxDB admin web interface. There are several available, some examples: a node.js influxdb-cli, a ruby influxdb-cli and a go influx-cli. The latest allows to pipe results into the command line, it is lightweight, feature-complete and reasonably fast.
We used a custom viewer interface that we created with new features like pagination, auto limit for select statements, server side cache, full back button functionality as well as command and login history. It makes working with long datasets easier. It will be available in https://github.com/trivago soon.
The road ahead
With the upcoming InfluxDB releases we will embrace tags, Metrics 2.0 and clustering. We will also be sending all metrics through Kafka instead of using the Graphite API and integrating Kafka with InfluxDB
And in the meantime we will have fun with ElasticSearch which is not a time series database but sometimes it looks like it is.

Follow us on