Real-time reporting of selenium tests on Kibana dashboard
The advances and growth of our Selenium based automated testing infrastructure generated an unexpected number of test results to evaluate. We had to rethink our reporting systems. Combining the power of Selenium with Kibana’s graphing and filtering features totally changed our way of working. Now we have real-time testing feedback and the ability of filtering between thousands of tests, all in one Dashboard.
Almost a year ago, the automation team at trivago took on the challenge to scale the automated testing process and integrate it even more into the deployment process. Today, we support a solid Selenium grid based infrastructure able to perform UAT (User Acceptance Testing), Functional, UI, API and Mobile testing. Continuous testing produced tons of detailed HTML reports, but we needed a better overview of the results. With Kibana, we now have a unified dashboard for all tests with the possibility to filter and analyze our data, extend and share it across teams.

Setup overview
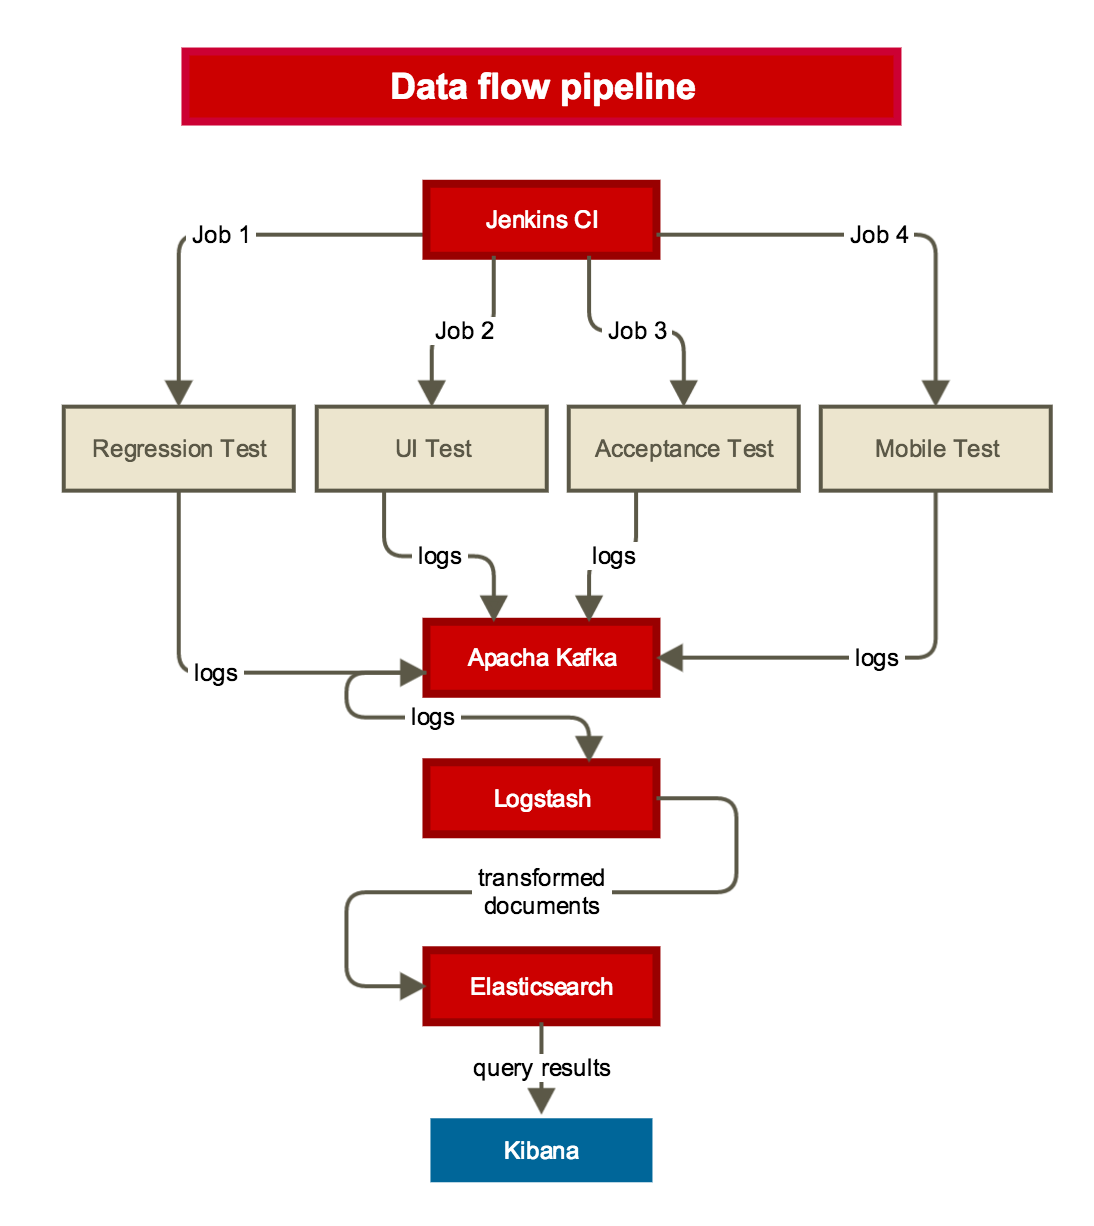
The setup is relatively simple, but we faced a few challenges along the way. The structure includes:
- Jenkins, for job deployment and management
- log4j setup for Kafka logging
- Kafka message broker
- Logstash for processing Kafka messages
- Elasticsearch for data storage
- Kibana for data visualization and exploration
Note: In this post, we will not go too much into detail about our Jenkins infrastructure, but rather our logging system and data visualization.
The role of Jenkins
Jenkins CI is our primary tool to control deployment of the automated tests. We have a simple setup consisting of a single master and a few physical/virtual machines as slaves. We included Proxmox in our setup for easy VM management. Our infrastructure at the moment allows us to have over 20 dedicated slaves, enabling tests on Windows, Linux and Mac OS, using Google Chrome, Mozilla Firefox, IE 10 and 11, and Safari. The setup for mobile is still in its early stages.
log4j and Kafka
The frameworks we have developed for automation vary from UI to Regression to API testing. They are unrelated except the fact that most are Java based and use Apache Maven as the build manager. This allowed us to reuse our logger setup and log on the same Kafka topic. The log4j is added in the POM file as a dependency for any java based Selenium project and is configured via a log4j.xml file.
First, we setup our log4j.xml file. log4j configuration is based on appenders. Appenders are necessary to set the destination of the logs, such as console, file, or in our case to a Kafka instance.
<?xml version="1.0" encoding="UTF-8" ?>
<!DOCTYPE log4j:configuration SYSTEM "log4j.dtd">
<log4j:configuration debug="true" xmlns:log4j='http://jakarta.apache.org/log4j/'>

    <appender name="YOUR_KAFKA_APPENDER_NAME" class="kafka.producer.KafkaLog4jAppender">
        <param name="BrokerList" value="<host(s) to reach Kafka, like 'x.x.x.x:port, y.y.y.y:port'>"/>
        <param name="Threshold" value="DEBUG" />
        <param name="Category" value="your_selenium_testing" />
        <param name="Topic" value="your_selenium_testing" />
        <param name="Serializer" value="kafka.test.AppenderStringSerializer" />
    </appender>

    <category name="your_selenium_testing">
        <priority value="DEBUG" />
        <appender-ref ref="YOUR_KAFKA_APPENDER_NAME" />
    </category>

    <root>
        <level value="DEBUG" />
    </root>
</log4j:configuration>
In our POM file, we included the following:
<properties>
    <log4j.version>1.2.17</log4j.version>
    <kafka.version>0.8.0</kafka.version>
</properties>

<dependencies>
  <dependency>
      <groupId>log4j</groupId>
      <artifactId>log4j</artifactId>
      <version>${log4j.version}</version>
  </dependency>
  <dependency>
      <groupId>org.apache.kafka</groupId>
      <artifactId>kafka_2.10</artifactId>
      <version>${kafka.version}</version>
      <exclusions>
          <exclusion>
              <groupId>org.slf4j</groupId>
              <artifactId>slf4j-simple</artifactId>
          </exclusion>
      </exclusions>
  </dependency>
</dependencies>
One problem that we came across with the setup change, was to exclude new slf4j dependencies added from other packages to resolve version conflicts. You can easily get a tree of your dependencies in Maven using mvn dependency:tree. You can read more about it at Resolving conflicts using the dependency tree.
If everything went well, log4j and the Kafka appender should be correctly configured. Our next step is to call an instance of our logger, and also give it some data from our tests.
Creating our logger instance:
// getLog of your appender Category from log4j.xml
private static final Log LOGGER: LogFactory.getLog("your_selenium_testing");
Following BDD (Behaviour-Driven-Development), we use JBehave for our business requirements specification, which gives us a set of Annotations like @BeforeStory, @BeforeScenario, @AfterScenario, similar to @Before, @After provided by JUnit. Using these annotations, we are able to call our logger as soon as our test cases start or end and react on different outcomes. We have created a class TestInit, which is extended from classes where we implement the logic behind the JBehave steps. In this class, we have the logger instance:
public class TestInit {

    /**
     * Setting log4j appender to LOGGER using its category name.
     * See log4j.xml
     */
    private static final Log LOGGER: LogFactory.getLog("your_selenium_testing");

    private String generateJsonFromLogMap(String result){

        Map<String, String> logMap: new HashMap<>();

        // START_DATE is a preset session value
        // Use @Given step when using JBehave to initialize START_DATE as a session value
        Date startDate: (Date) Serenity.getCurrentSession().get(SessionValues.START_DATE);
        Date endDate: Calendar.getInstance().getTime();
        DateFormat df: new SimpleDateFormat("MM-dd-yyyy HH:mm:ss");
        long testDuration=endDate.getTime()-startDate.getTime();

        // setting test outcome result
        logMap.put("result", result);

        // time-related values
        logMap.put("timestamp", df.format(endDate));
        logMap.put("duration", String.valueOf(testDuration));

        // system properties, provided via VM options on run, especially from Jenkins
        logMap.put("os", System.getProperty("os")); // vm option -Dos=OS_Name
        logMap.put("build_number", System.getProperty("buildNumber")); // vm option -DbuildNumber=${BUILD_NUMBER}

        JSONObject logEntries: new JSONObject(logMap);
        return logEntries.toJSONString();

    }

    // ON SUCCESS
    @AfterScenario(uponOutcome: AfterScenario.Outcome.SUCCESS)
    public void logSuccessfulScenario() {

        LOGGER.debug(generateJsonFromLogMap("passed"));
    }

    // ON FAILURE
    @AfterScenario(uponOutcome: AfterScenario.Outcome.FAILURE)
    public void logFailedScenario() {

        LOGGER.debug(generateJsonFromLogMap("failed"));
    }
}
Information is collected in the @Given step definition level, using AspectJ, an aspect-oriented extension for Java. You can create rules to which your application should adhere to, triggered on an exception or a method/annotation call. This allowed us to define a single method triggered by calling the @Given steps, which passes information via AspectJ directly to the logger.
The ELK stack

We use the ELK (Elasticsearch-Logstash-Kibana) stack which was already in heavy use in other places at trivago. We also evaluated another setup before deciding on Kibana and Elasticsearch. Combining InfluxDB, a time series database and Grafana, a dashboard builder (for Graphite and InfluxDB) was the alternative solution.
The reason we chose ELK was that we wanted to do data-analysis on our test data. Kibana has good filtering and selection options for that. This enables us to explore our data, without having to split it over too many graphs on several dashboards. Our dashboard gives us the ability to filter the noise via tables. These tables divide the data per testing environment, operating system, browser, server, and test areas. This allows us to see clearer trends in the data and gives the test engineers much more flexibility to work with results. Via Kibana, we finally have statistical and historical information of our testing process.


The tests produce JSON format logs that are sent to Kafka. Since Kafka is only a message broker, the data is pulled by Logstash instead of being sent directly to Elasticsearch. Logstash or some other message consumer is also needed to process the data first. The data might need to be transformed, either from some custom log format to JSON, or in our case from JSON to an enriched JSON object which is more suitable for Elasticsearch ingestion.
We picked Logstash as a Kafka consumer because, developed together with Elasticsearch, it guarantees maximum compatibility and easy configuration due to shared naming conventions.
# This configuration is valid for logstash 1.5.x
input
{
    kafka
    {
        zk_connect:> "your.zookeeper.ip:2181"
        codec:> json
        topic_id:> "your_selenium_testing"
        consumer_threads:> 1
        consumer_id:> "Logstash_Selenium_reg_Test"
    }
}
filter
{
  date
  {
    match:> ["timestamp", "MM-dd-yyyy HH:mm:ss"]
    remove_field:> ["timestamp"]
  }
}
output
{
  elasticsearch
  {
    protocol:> "http" # remove this line if you plan to use logstash 2.0.0
    host:> "your.elasticsearch.ip" # rename this to hosts if you plan to use logstash 2.0.0
    index:> "qa_%{index_name}-%{+YYYY.MM}"
    index_type:> "%{doctype}"
  }
}
This configuration allows us to use the same Logstash process for handling the data of multiple testing projects. All of our log messages are equipped with the fields “doctype” and “index_name”. The developer who sets up a new test project can specify the name of his project (index_name) and different types of test data (doctype) within that project. Logstash will fill the variables in the Elasticsearch configuration with those values. This generic approach eliminates the necessity to set up a new Logstash instance for each new testing project.
Final result

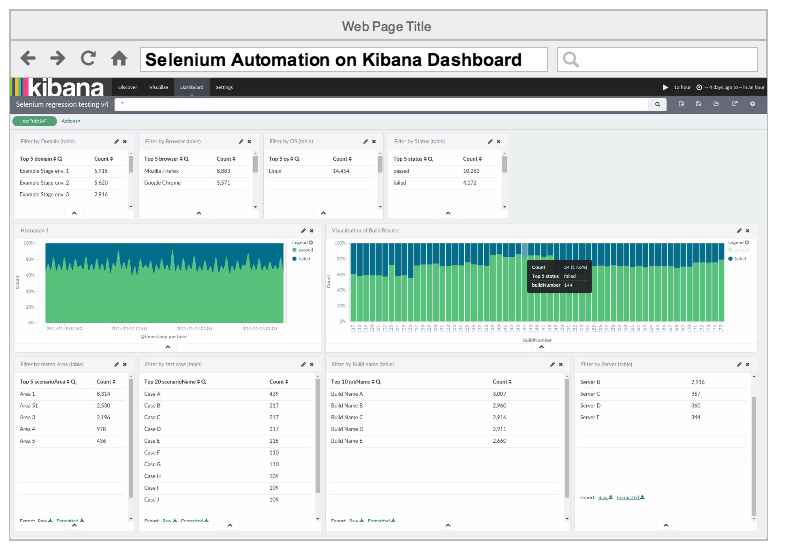
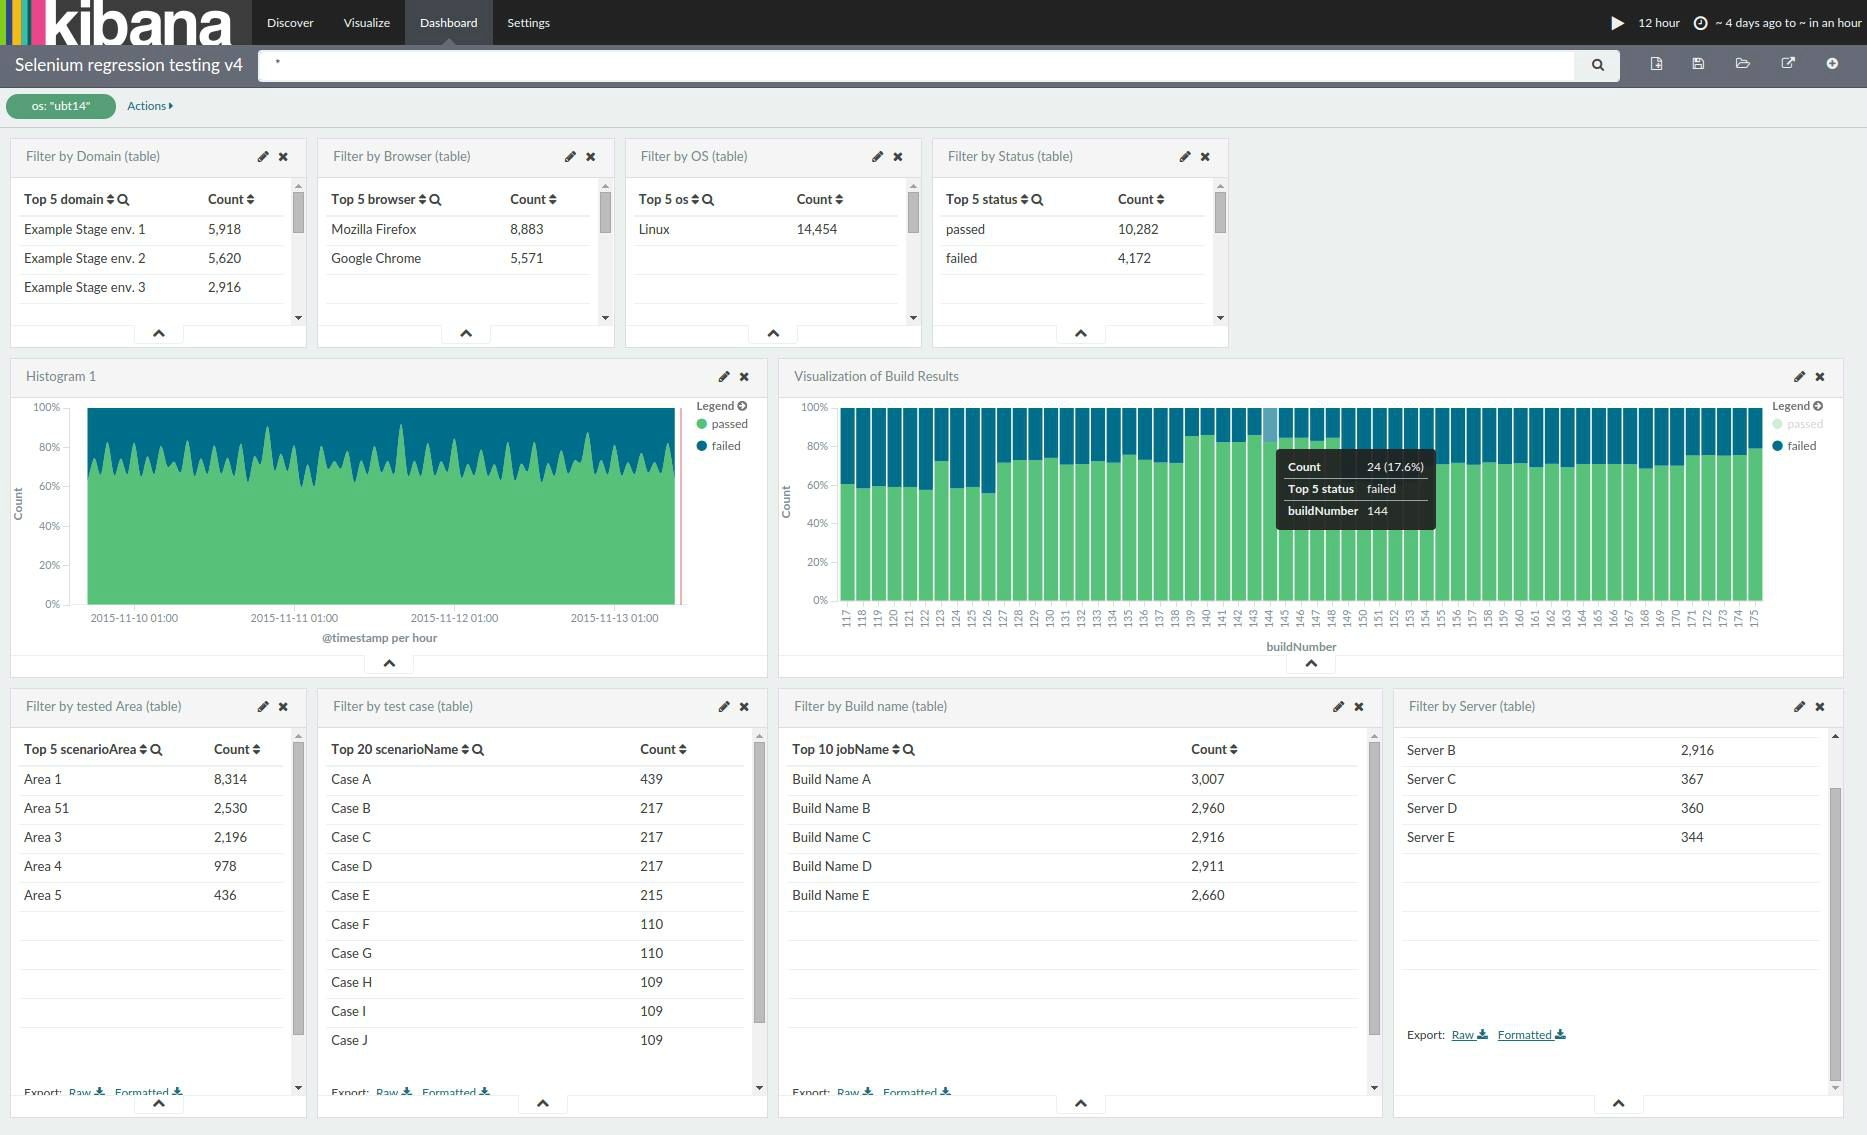
On the screenshot above you can see the finalized dashboard. It gives us an overview of successful and failed builds over time. The first row splits up the Selenium tests into domain, browser and operating system categories. It also shows the total amount of successful and failed builds as a simple counter. The second row shows a graphical overview of the Selenium test results. On the left you can see a trend over time for all tests. Blue means failed, green means passed tests. On the right, you can see the results per build. The dashboard shows the build number and the total count of tests. We could add more metadata here if necessary.
At the bottom of the dashboard you have four areas:
- Scenario area: A group of test cases. Tests are grouped by specific features. For example we have different test areas for SEO optimizations and Sales.
- Scenario name: This is one test case.
- Job names: Jenkins job which ran the tests. For example you could see here if a Jenkins job did not run at all.
- Server: The server where the application under test was running.
Overall this gives us a pretty good overview of all automated tests we run here at trivago.
Future improvements
Although a huge step forward in automation reporting, there is already a list of ideas to be added to this setup. Some of the planned features to be added are:
Merge-Event Notifications: Annotate all merge requests which affect those environments being tested. With the help of this feature, we can find bugs directly after a code merge.
Release-Event Notifications: Annotate release events for live environments being tested. This feature would be useful in the event of a bug pushed to live or if code does not behave as intended.
Acknowledgements for making this project possible go to Sergey Roshchupkin, Automation Engineer at trivago, and our Performance team.

Follow us on