We’re a data-driven company. At trivago we love measuring everything. Collecting metrics and making decisions based on them comes naturally to all our engineers. This workflow also applies to performance, which is key to succeed in the modern Internet.
The never-ending journey for performance
Our mission is to provide the user with the ideal hotel at the lowest rate. Our backend consists of several services written in different languages. To succeed at this goal we do complex tasks in our main application developed in PHP. While doing this we need to keep the website as fast as possible.
We started to look for some tool that could help us identify performance issues in our code base. We evaluated Blackfire and decided that it was a good fit for our use case.
Why Blackfire?
Blackfire is a Performance Management Solution that can be used to optimize the performance of an application at each step of its lifecycle: in development, QA, staging, and production. For our company it is a perfect match, because:
Support for the FreeBSD operating system.
Blackfire offers full support for FreeBSD, which we run on our frontend webservers to serve PHP requests.
Clear syntax to write tests/assertions.
The clear YAML syntax supported by Blackfire allowed us to approach performance budgets using tests, which results in better visibility into performance monitoring for all developers.
Nice UI to interact and explore your application’s code.
Blackfire offers an intuitive UI that is a great for identifying performance bottlenecks in your code. The filters and visualizations are useful for exploring and identifying the hot path of your application.
Possibility to define custom metrics.
Custom metrics allow us to tailor-fit Blackfire to the project requirements. Although we’re not using this feature yet, it’s on our roadmap.
Integrating blackfire into our workflow
Set up
For provisioning/orchestrating our servers we use SaltStack. We created specific roles for installing and configuring Blackfire for the stage and production environments. Any developer can profile any server in stage or production. This means that if profiling is needed in a certain server, the developers only need to add a specific role to the grains file.
To use Blackfire we need to install and configure both the agent and the probe/extension. We opted for running a central agent per environment, which means that all servers in the same environment (e.g. all production webservers in our Hong Kong datacenter) will connect to the same agent. This approach allowed us to keep the web servers agnostic to our credentials. Also, it avoided some issues when we’re profiling behind our load balancers.
For local development, we use the Docker image provided by Blackfire. This, combined with our own containers, provided a simplified workflow. Even more, we provide a Makefile with some commands that our developers use for daily tasks. And yes, we include a couple of commands to help them run profiles:
...
profile         Start a profiling run using blackfire.io
                (e.g. make profile URL="<dev URL to profile>")
profile-cli     Profile a PHP file
                (e.g. make profile-cli FILE=my-script.php)
...
Workflow
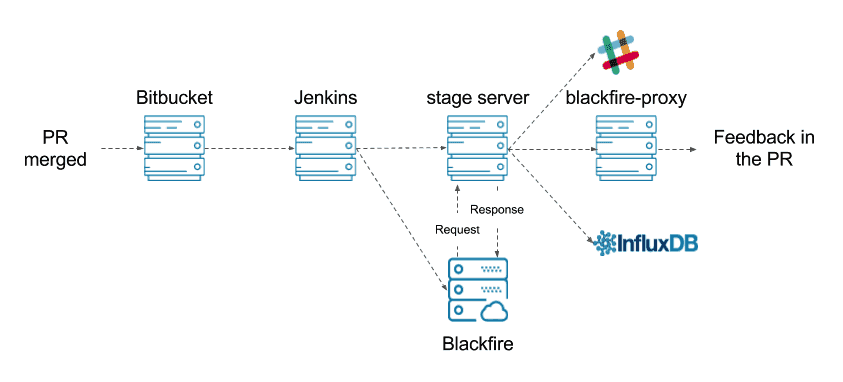
Our developers submit all the changes as Pull Requests inside our Bitbucket Server. The QA team can deploy these branches into separated boxes for further testing. Usually, after the PR is merged into master, a Jenkins job will be triggered to execute the unit test suite. If the execution of the unit tests is successful, then a new Job will deploy the code into our stage server. Once the deployment is completed our acceptance tests will be executed (this could take some time). After the execution of the acceptance tests is completed the code is ready to continue its journey to production. At this point we trigger a new Blackfire build for measuring how the new changes impact our performance.

Our main goal is to provide feedback to the developers as soon as possible about the impact of their changes on the performance of the application.
We execute the profiling run on an isolated server, which does not handle other requests. Think of it as synthetic performance monitoring. This helps to minimise the noise in our measurements by reducing the number of external factors.
We’ve configured Blackfire to post a notification on a Slack channel if the build fails. This “notify on failure” approach allowed us to reduce the number of interruptions of our developers, while still getting notified if a performance regression is detected. The notification posted by slack will look like:

Bitbucket integration
To host our codebase we use Bitbucket Server. This was a pain point for us because Blackfire only supports Bitbucket Cloud. To ensure a good integration between both products we built blackfire-proxy. As the name suggests blackfire-proxy is a bridge between both services. At the moment blackfire-proxy has three main responsibilities:
- Toggle the build status of the merge commit of the Pull Request.
- Add a comment to the PR with the status of the build, as well as the main metrics for each scenario.
- Send the collected metrics (Wall time, CPU time, IO time, Memory and Network) for each scenario to InfluxDB.
If blackfire-proxy sounds like something that you’ll like to have in your stack, keep in touch. We’ll be releasing it as an open source project for everyone to use.
Since we provisioned all our dev/staging/QA servers with the required configurations any developer can profile any server. This helps when developers need to profile in a more realistic scenario.
We try to keep the comment posted to the PR small, precise and useful. At the moment we include a link to the Build Report and some details about the specific scenarios. For each scenario, we include a status indicator, tested URL, main metrics, and a link to the profile. If any of the scenarios fail, then we add a small section with the failed tests of the scenario. This information is enough for everyone involved to know if everything is ok. At the same time, it is simple enough to go deeper if something failed.
Example comment posted by blackfire-proxy when all scenarios succeded
Example comment posted by blackfire-proxy when some scenario fail. Notice the section with the failed tests highlighted.
Metrics and profile runs
When we started using Blackfire, we noticed that it didn’t offer any historical data. We wanted to keep track of the performance of our application over time so we added this feature to blackfire-proxy. We already use InfluxDB for storing our metrics so it was not difficult to put in place. It’s important to highlight that since then the Blackfire team has added a new feature to give access to historical data.
We even built some cool dashboards on top of the data (using Grafana):
In comparison, our approach is still more flexible. We can aggregate the data over different time periods, which is not possible to do on the Blackfire UI. At the moment you only get metrics in a 1-day resolution period. Also, we can add extra metadata to the metrics and even configure alerting on top of the collected data.
Conclusions
In summary, Blackfire allowed us to:
- Enforce a backend performance budget to stop continuous performance degradation over time.
- Detect performance bottlenecks before they’re deployed to production.
- Offer a common platform for PHP developers to discuss performance related issues.
What’s next?
At the moment we’re using the default metrics that Blackfire collects from our Symfony2 application. But in the long run, we would like to add some custom metrics, which are more fine-tuned for our use-case.
At any given moment we have over 100 A/B tests running on our website. It’s possible that a particular test (or experiment) is making our website a bit slower than usual. This is something hard to spot because it will only be detectable if that specific test was enabled when the profiling was done. We’re already focusing on how to improve the detection of these issues even before the A/B test is enabled for our users.


Follow us on