
If you’ve never heard about Memcached, it is simply a high-performance, distributed memory caching system which uses a key-value store for strings and objects. Usually, it serves for saving data originally retrieved from a database or external services. As simple as it is, it can improve the performance of your website quite a bit. The API of Memcached is very simple and accessible from most of modern programming languages. A simple example:
public function getYouData(string $key) {
   $yourData: $memcached->get($key);
   if (!$yourData) {
       $yourData: $yourDb->getAll();
       $memcached->set($key, $yourData);
   }
   return $yourData;
}
At trivago, we are using Memcached mostly as our caching layer. We have a cache interface that “hides” the logic, so we (the developers) don’t have to think much about its implementation just to know how the interface works. Currently, the cache is used in almost every repository we use in our PHP codebase. We already have quite a bit of them and the number increases with each passing release.
Then one day our logs started to be filled with Memcached errors. The method get failed and all requests went directly to the database. Of course these calls also failed under the huge load, and eventually we had problems ensuring uptime of trivago’s entire platform. Yaiks!
So what happened? Why did we start having problems with Memcached?
The reason was spider traffic sent by a botnet from more than 200 countries and with 70K unique IPs. It was hitting a particular page type with an intensity of 40 times higher than normal.
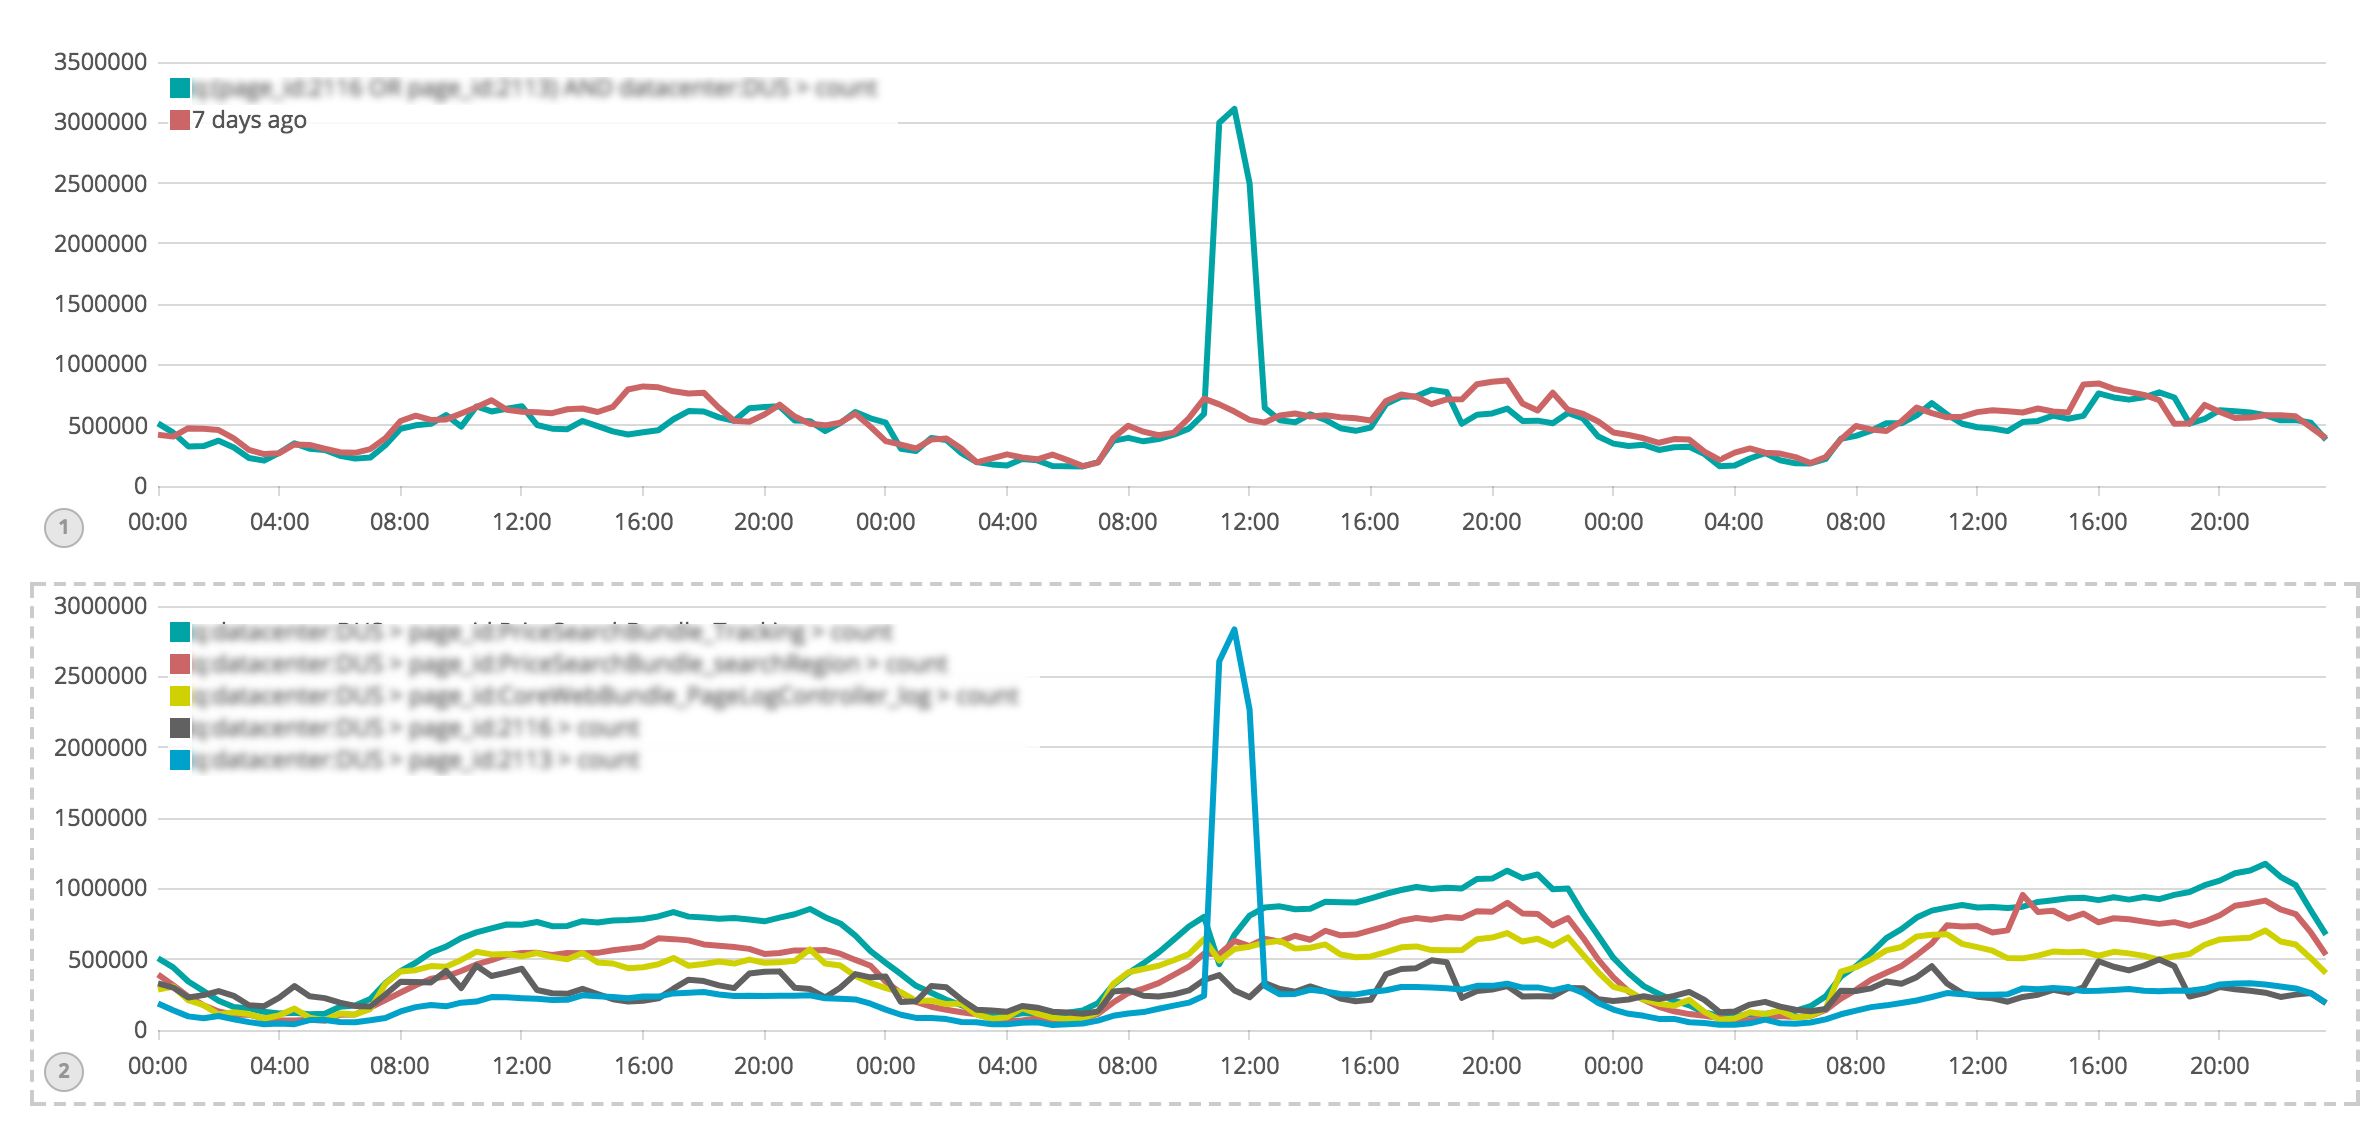
Our spider throttling mechanisms were triggered 10 minutes after the attack started and slowly mitigated the impact.
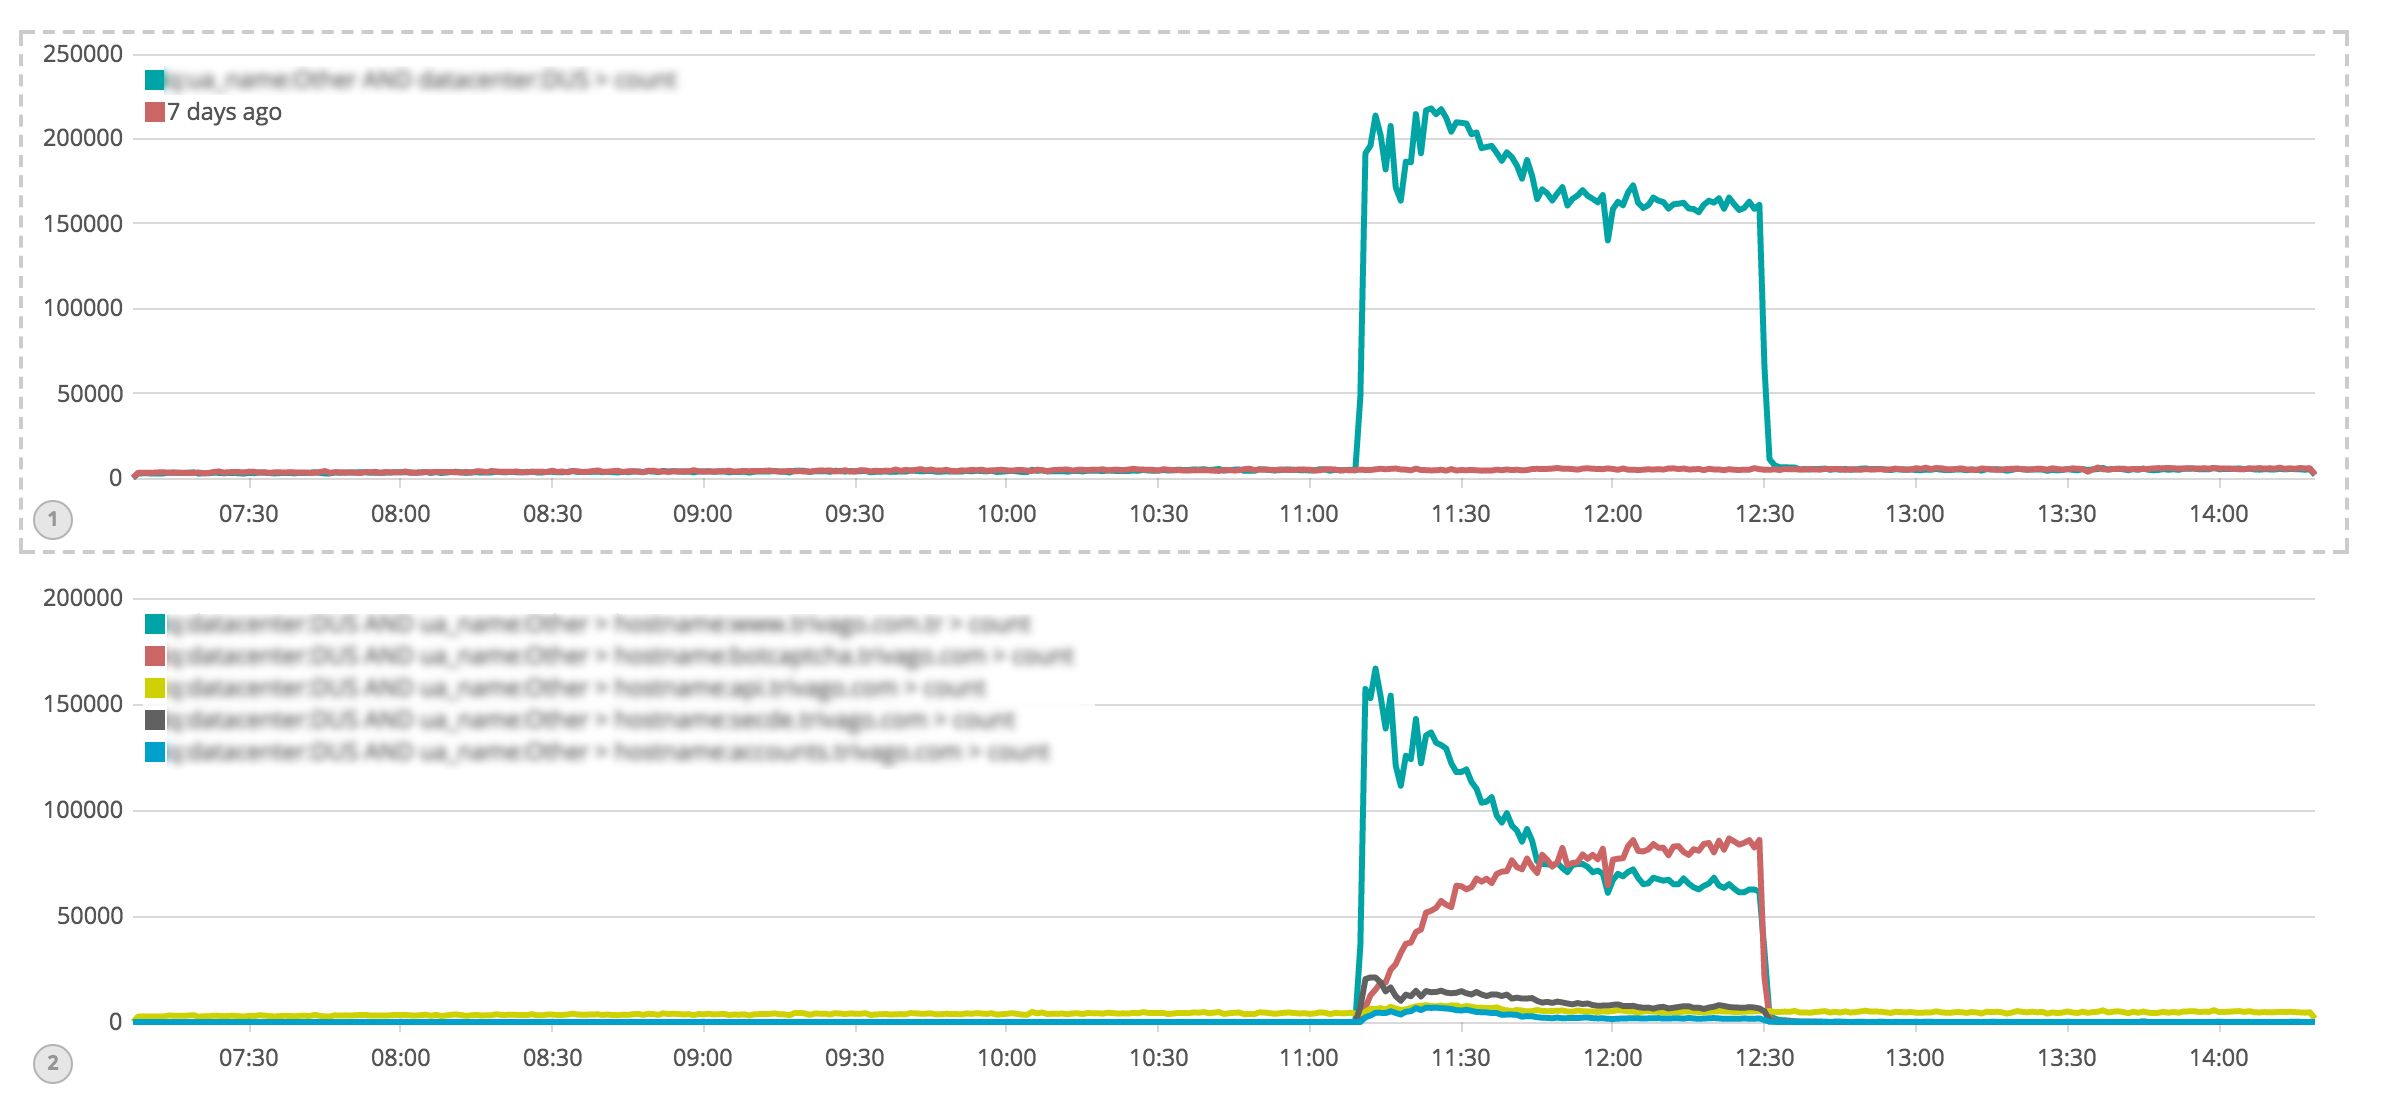
The result of this impact was saturation of the Memcache network interfaces which used 1Gbits maximum capacity of the network interfaces. Most of the saturation was caused by get/hit requests to one of our Memcached pools.
This pool was using around 4GB of memory. Obviously, something went wrong there.
The first step was to start logging more information related to the cache. Of course, we already had logs but there was no way to see which cache key was consuming the most memory. Thus we added extra logs for cache value size.
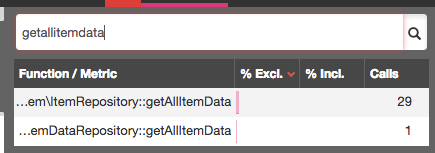
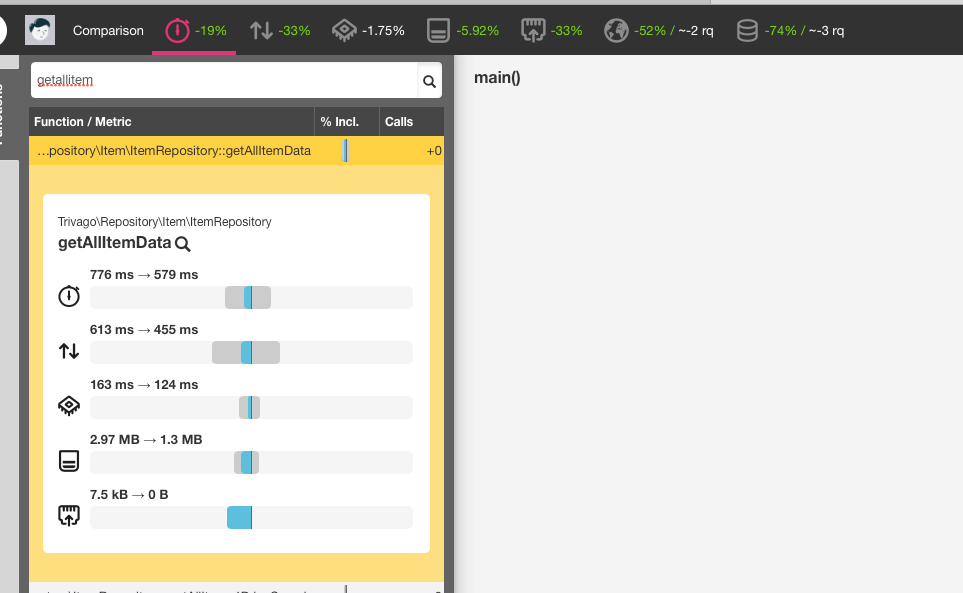
A day after deployment of these logs we spotted the monster. It was in our ItemRepository method getAllItemData that was caching ~10MB of data on average.
Just the name of the method sounds scary, right? And it gets scarier, this method was created in 2014 and has not been touched since 2015. According to results of Blackfire profiling, getAllItemdata was called 30 times per single page load.
So we dug into the code and found out why that cache value was so big. Turns out we were using default Memcached serialization, more precisely native PHP serialize / unserialize methods (we stopped using the igbinary extension since we migrated to PHP 7 because it was causing issues in combination with the Memcached extension, hence the serialization fell back to php). This means that besides the data that we had to store we were also storing every object with its full class name, its properties and so on, and the same for its sub-objects. Nice.
But, hey, should be a fairly simple just change from PHP serialization to something more compact.
Since igbinary would have been a bigger change in our infrastructure, we were considering JSON or Protobuf but because we wanted something that is flexible and quick to implement we decided to go with json. It’s a simple and lightweight data transfer structure. Everything looks straightforward so far.
The thing about JSON is that it’s schemaless, so for encoding everything is fine, but for decoding you have to map the data back to corresponding PHP objects.
We were thinking whether to use an external library or to implement mapping manually. Symfony component Serializer came to mind. However after some benchmarking we decided to simply map objects manually. The reason was PHP performance. Using Serializer includes a complex structure of extra Symfony layers on top of our implementation. Manual mapping meant for us only one extra call to our internal entity. Moreover, it was under our control which gave us extra flexibility in implementation.
So far so good, we:
- implemented
json_encodefor the data retrieved from database - changed the cache key prefix to make sure it doesn’t collide with existing ones
- added
json_decodefor fetching data back from Memcached - mapped data back to corresponding PHP entities / objects
Sounds quite simple, right?
But then we ran the tests and noticed that json_decode was constantly returning either a Syntax error 4, Control character error 3 or Malformed UTF-8 characters error 5 instead of our lovely data.
Why on earth …
Oh ok, maybe it’s because of some special international characters, which could have been returned from our DB and should have been Unicode encoded first.
So we tried with json_encode option JSON_UNESCAPED_UNICODE… Didn’t work. Then we gave a chance to several other PHP functions such as utf8_encode and mb_convert_encoding. Sadly we couldn’t foresee what kind of encoding would be returned from the DB: sometimes it was ASCII, sometimes UTF-8. Nothing above worked, and we were getting desperate as we were trying to find the reason for this behaviour for about 2 days.
Since the structure of our data was a multidimensional array of objects, for debugging purposes we removed sub arrays and encoded only first level array. At that moment json_decode stopped throwing errors.
It looked like we were getting somewhere finally, there must be something in the actual data of that sub array, so we removed piece by piece of those sub objects to see when it works and when not. But even when we remove all properties from the sub object, so that the array contains only empty objects it still failed to decode. That was suspicious, and we started doubting that errors were related to our data any more. So we did more debugging and found out that data was corrupted by Cache Interface, meaning by Memcached itself.
Ok, now the clue is that something was wrong with Memcached.
We did a research about the combination of Memcached, JSON encode / decode and its syntax errors. Eventually, we discovered a GitHub issue which describes a bug in Memcached caused by trying to store JSON encoded string longer than 2000 chars! The same problem could also have been on our side because those sub arrays for each item are quite large. So we quickly checked the version of our Memcached and it was 3.0.0b1 which still contained this bug. Luckily this bug was already fixed in newer versions, so we updated Memcached to 3.0.2, and decoding finally worked.
Oh, the joy!
Now we had to confirm that JSON was indeed an improvement for the Memcached memory.
After we applied the update to our dev servers, it was indicating a solid improvement. For testing purposes, we ran the trivago Selenium test suite against master and our dev branch. Thanks to Kibana logging we had a good visibility on cache memory usage. The difference between master and our branch was ~50%.
That was not all. Besides watching cache usage logs, we also had to think about our website performance. To make sure new changes did not affect / improved other performance criteria, we did intensive testing with Blackfire.
Blackfire was not only checking network and overall trivago performance, but also helped us to spot the bug in Memcached. It explicitly warned us about an increase of SQL queries for the getAllItemData method per page load by ~20. There should have been only a few of them since the data were supposed to fallback on the database only if they weren’t found in the cache.
Thereafter we did more comparing with other dev branches to test the reliability of Blackfire and everything seemed to be legit.
The improvements were looking promising, hence we wanted to move on and merge our branch to master. Nevertheless the change was very delicate since the getAllItemData method is implemented in one of our core repositories which is being used across almost all PHP applications at trivago. Therefore we had to make sure first to update Memcached on every server with a running PHP. This took some time, but eventually after about one month since the first server was upgraded, we successfully deployed a new version of Memcached everywhere. At that moment we could finally go ahead with merging and deploying our code base.
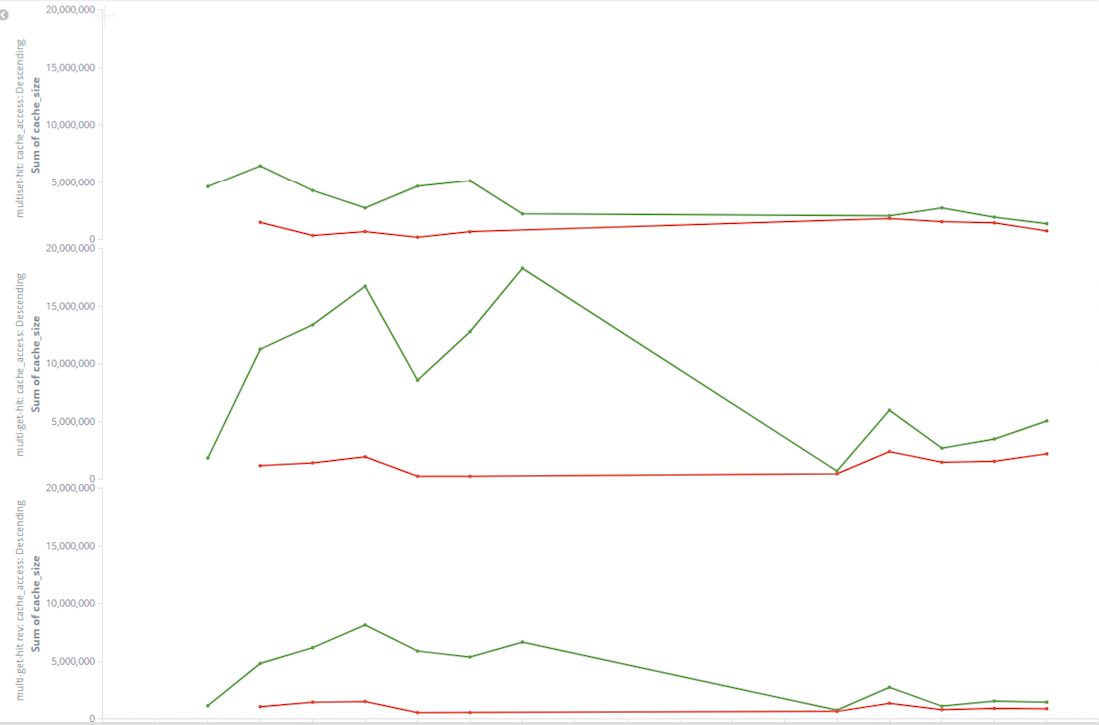
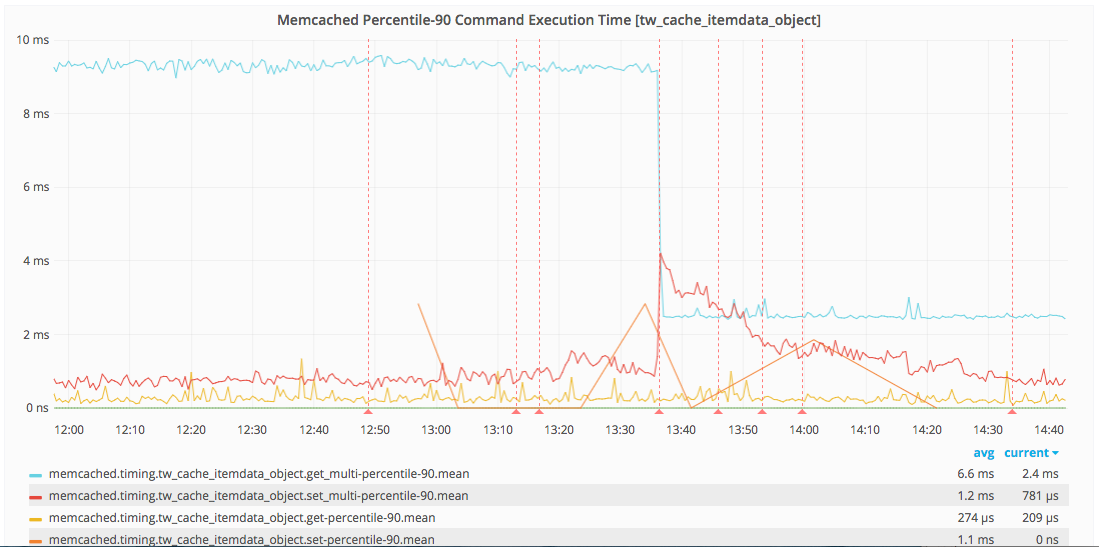
A couple of hours after deployment we saw a huge drop in memory usage and it was just beautiful!
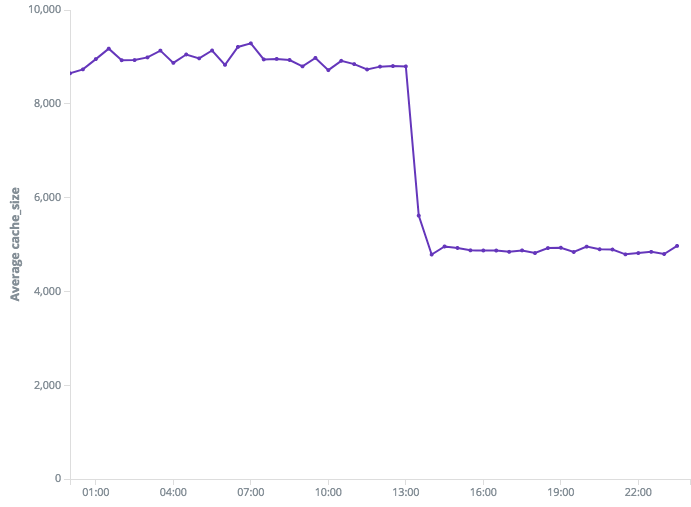
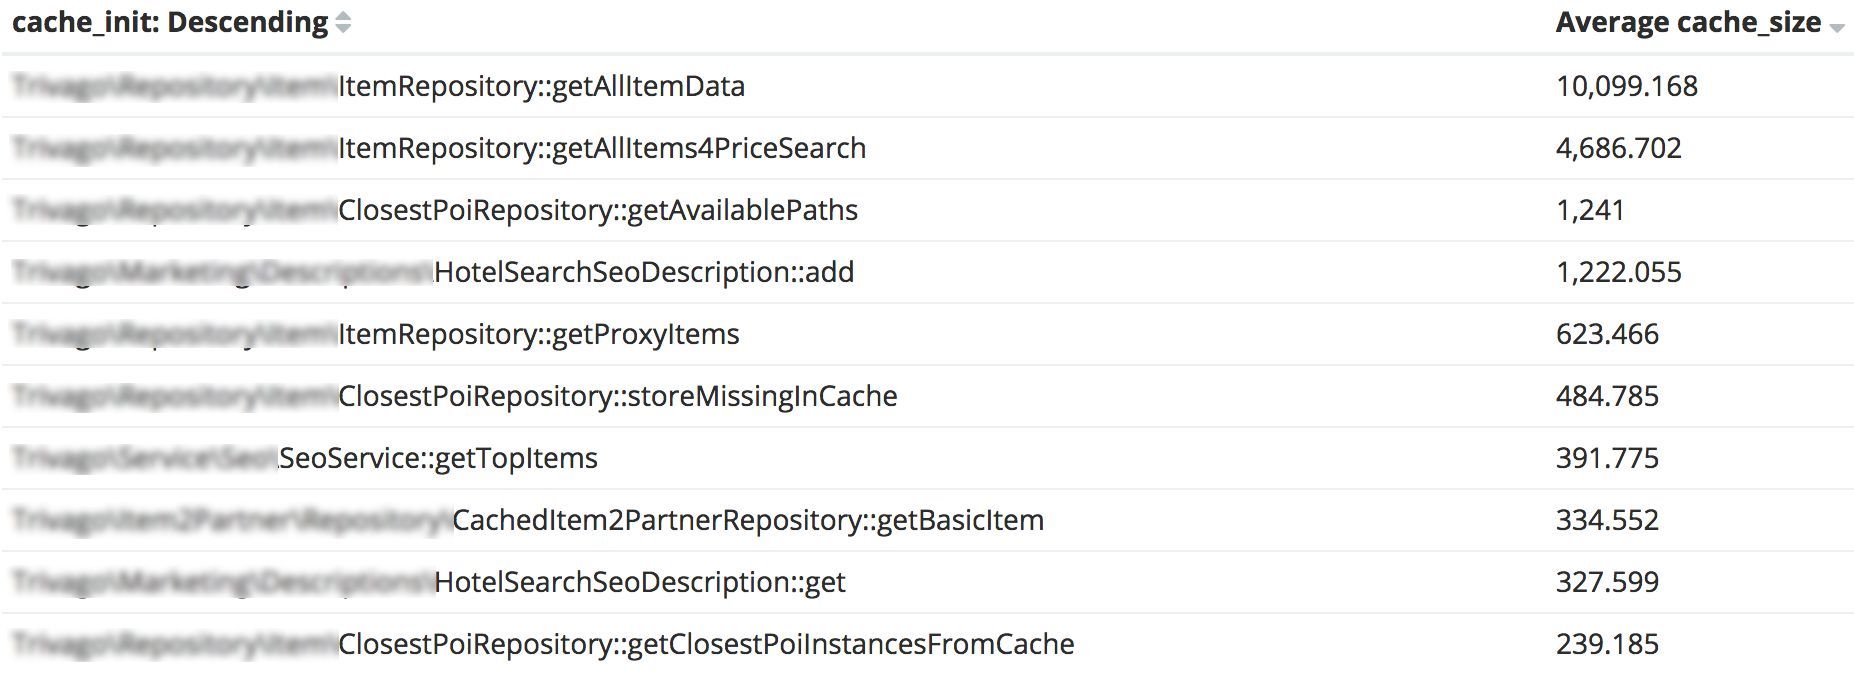
Now the same method is consuming ~5MB, which is quite an improvement comparing to the previous size of ~10MB.
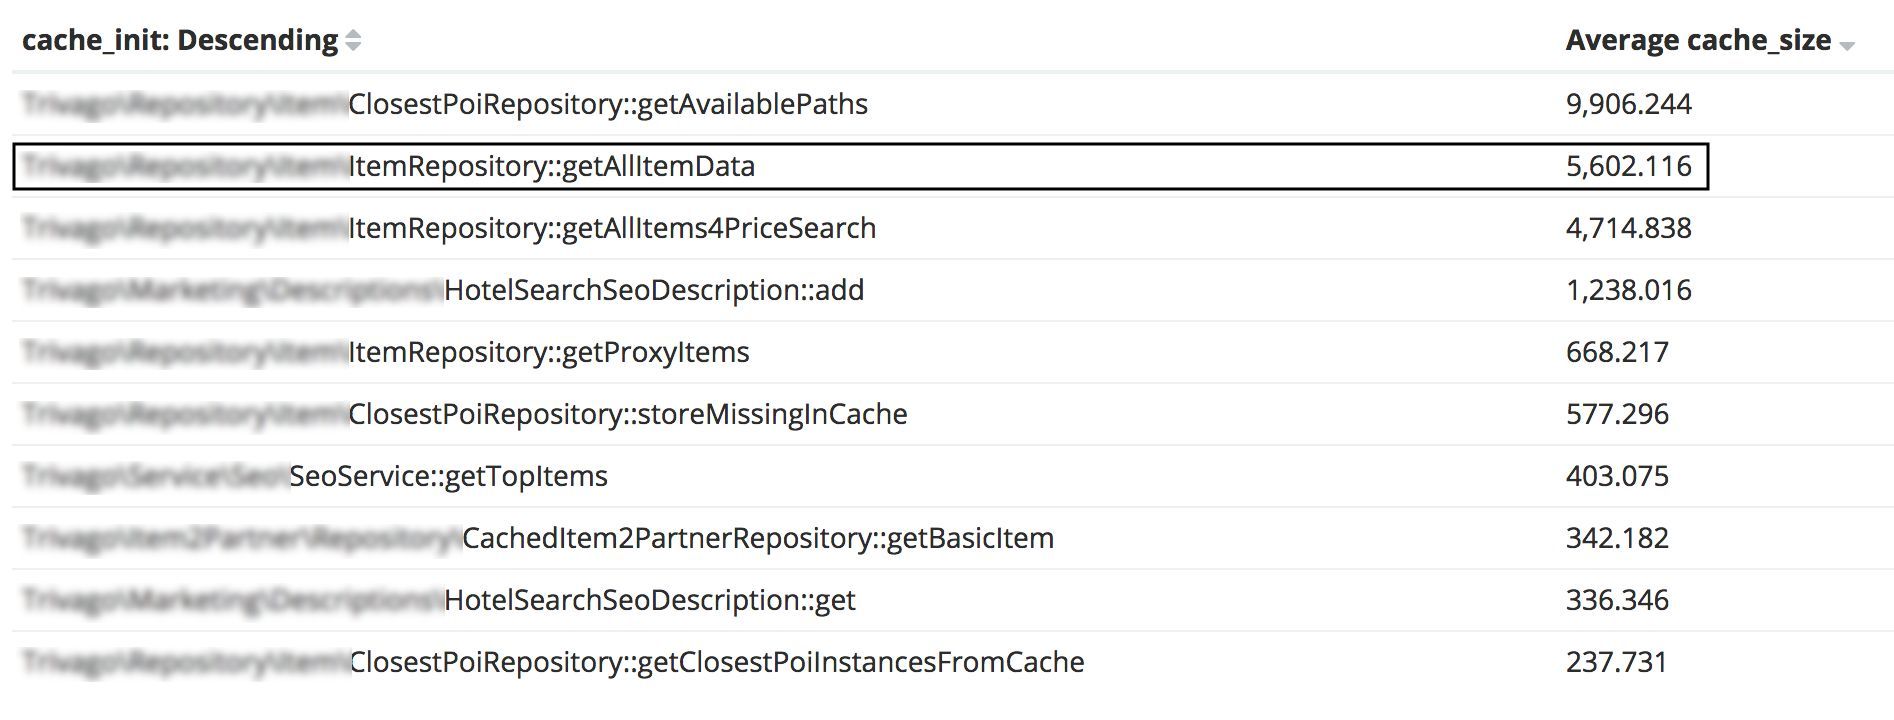
As per the screenshot above, you can clearly see the next candidates for optimization like getAvailablePaths with ~9MB and getAllItems4PriceSearch with ~4MB of memory used. We will tackle them in the near future to make sure trivago is fully prepared for the next year’s summer traffic.
We would like to give special thanks to Jakub Sacha, Luca Pizzamiglio, Xoan Vilas and Heiko Hilbert for supporting us in finishing this project.


Follow us on