
Continuously testing trivago at scale
Test, test, test. If you don’t, an issue is bound to crop up in production sooner or later.
We’ve all heard this mantra in one form or another. The importance of testing your software has been covered by countless articles, books and conferences. You worked hard on your code coverage and your downtime due to regression-related bugs has severely decreased.
Everyone is happy:
- the programmers have ease-of-mind because they can quickly find the causes of bugs;
- the system administrators are happy because the code is more stable and fewer risky rollbacks are needed;
- the Product Owner doesn’t have to allocate as much time in the sprint for dealing with bugs so more features can be made;
- the boss is happy because less downtime leads to more money.
You’ve covered all your functionality. Job done. Until…
A story: Unsatisfied customers
You get notified by Customer Support. They have spotted an increase in leaving customers over the last few months. User research has shown that the site has many performance issues. Other customers complain about a decrease in accessibility of your site and control panel. They are threatening with legal action according to their local laws.
“How didn’t we see this coming?” the boss asks. “I thought your tests were enough?”
Testing beyond functionality
As the made-up story above shows, functionality is not the only important thing to test. Your site also has non-functional requirements. These might differ for each site, but usually there’s an overlap. Common requirements are: performance, capacity, availability, scalability and accessibility.
Wasting valuable time of the Quality Assurance department on features that don’t pass the unit tests is a no-no. Why then, would you ask them to test a feature if it made the system grind to a halt?
The best way is to make results of non-functional testing visible to the developers as early as possible. This means on every commit. Sure, you can only run the tests on production, but at that point it’s hard to figure out which commit introduced a particular regression in performance. This is especially the case with longer-running branches.
Set-up for early feedback
At trivago, a production build currently takes a considerable amount of time. The codebase is big, the pre-processing and post-processing toolchains are large. We work hard on improving this, but it’s a challenge.
Still, making a production build, and running that in a stage environment, is worth the CPU cycles. For scaling this, we introduced “Project Hydra”, named after the mythical creature (for every head chopped off, the Hydra would regrow two heads).
Hydra’s origin story
Hydra started as a project in which we wanted to show that Docker could be used as a stable build environment. Up till that point, we used a tailor-made build environment for building our stage and production builds. Of course, this meant that if a developer wanted to experiment with different software versions… she couldn’t.
A secondary goal was to run non-functional tests to prevent regressions from our accessibility and performance initiatives before they hit production.
Scaling Hydra’s infrastructure
With hundreds of commits to dozens of active branches each day, testing every commit can become a strain on server resources. Here’s how we dealt with that.
Phase 1: Scaling up Jenkins
With building our codebase for every commit, we’d need to find a way to increase the capacity of our Jenkins builders. Docker was the best option and so we added two bare-metal servers to deal with the new Docker build. Build scripts were adjusted and everything was fine. Of course, at that moment, the “real” stage and production builds would still use the old, specialised build server.
The build output was later combined with our Apache configuration and spawned in a Nomad cluster. Run-time configuration was passed in to complete the set-up. A Jenkins job took care of running the non-functional tests and then killing the deployed Nomad jobs after 10 minutes.
Phase 2: Moving to declarative pipelines
The Release team overhauled our Jenkins infrastructure and started to move away from the special build servers. The Docker-based build script came in handy, was adjusted and optimised and now was responsible for some stage builds. The Jenkins Pipelines were changed from the scripted variant to the declarative one. We ran into problems with the size of the pipelines and had to break up the testing code in separate jobs to keep the desired parallelism.
Phase 3: Instant, on-demand QA environments
Sometimes you need a fresh pair of eyes to see improvements. Luckily my colleagues came up with a great idea: a proxy that would auto-start our “preview build” instances on-demand in Nomad and would also kill the instance if it hadn’t been accessed for a while. This would keep everything clean.
As an added benefit, our QA department didn’t have to wait until a manual build was done. Accessing a URL was enough. Often, the preview instance was already up-and-running and exploratory testing could start immediately. And if it had to be started, it would take less than a minute. This was a big time-saver.
The pipeline
We use Jenkins as our main build system. Our Hydra pipeline is the following:
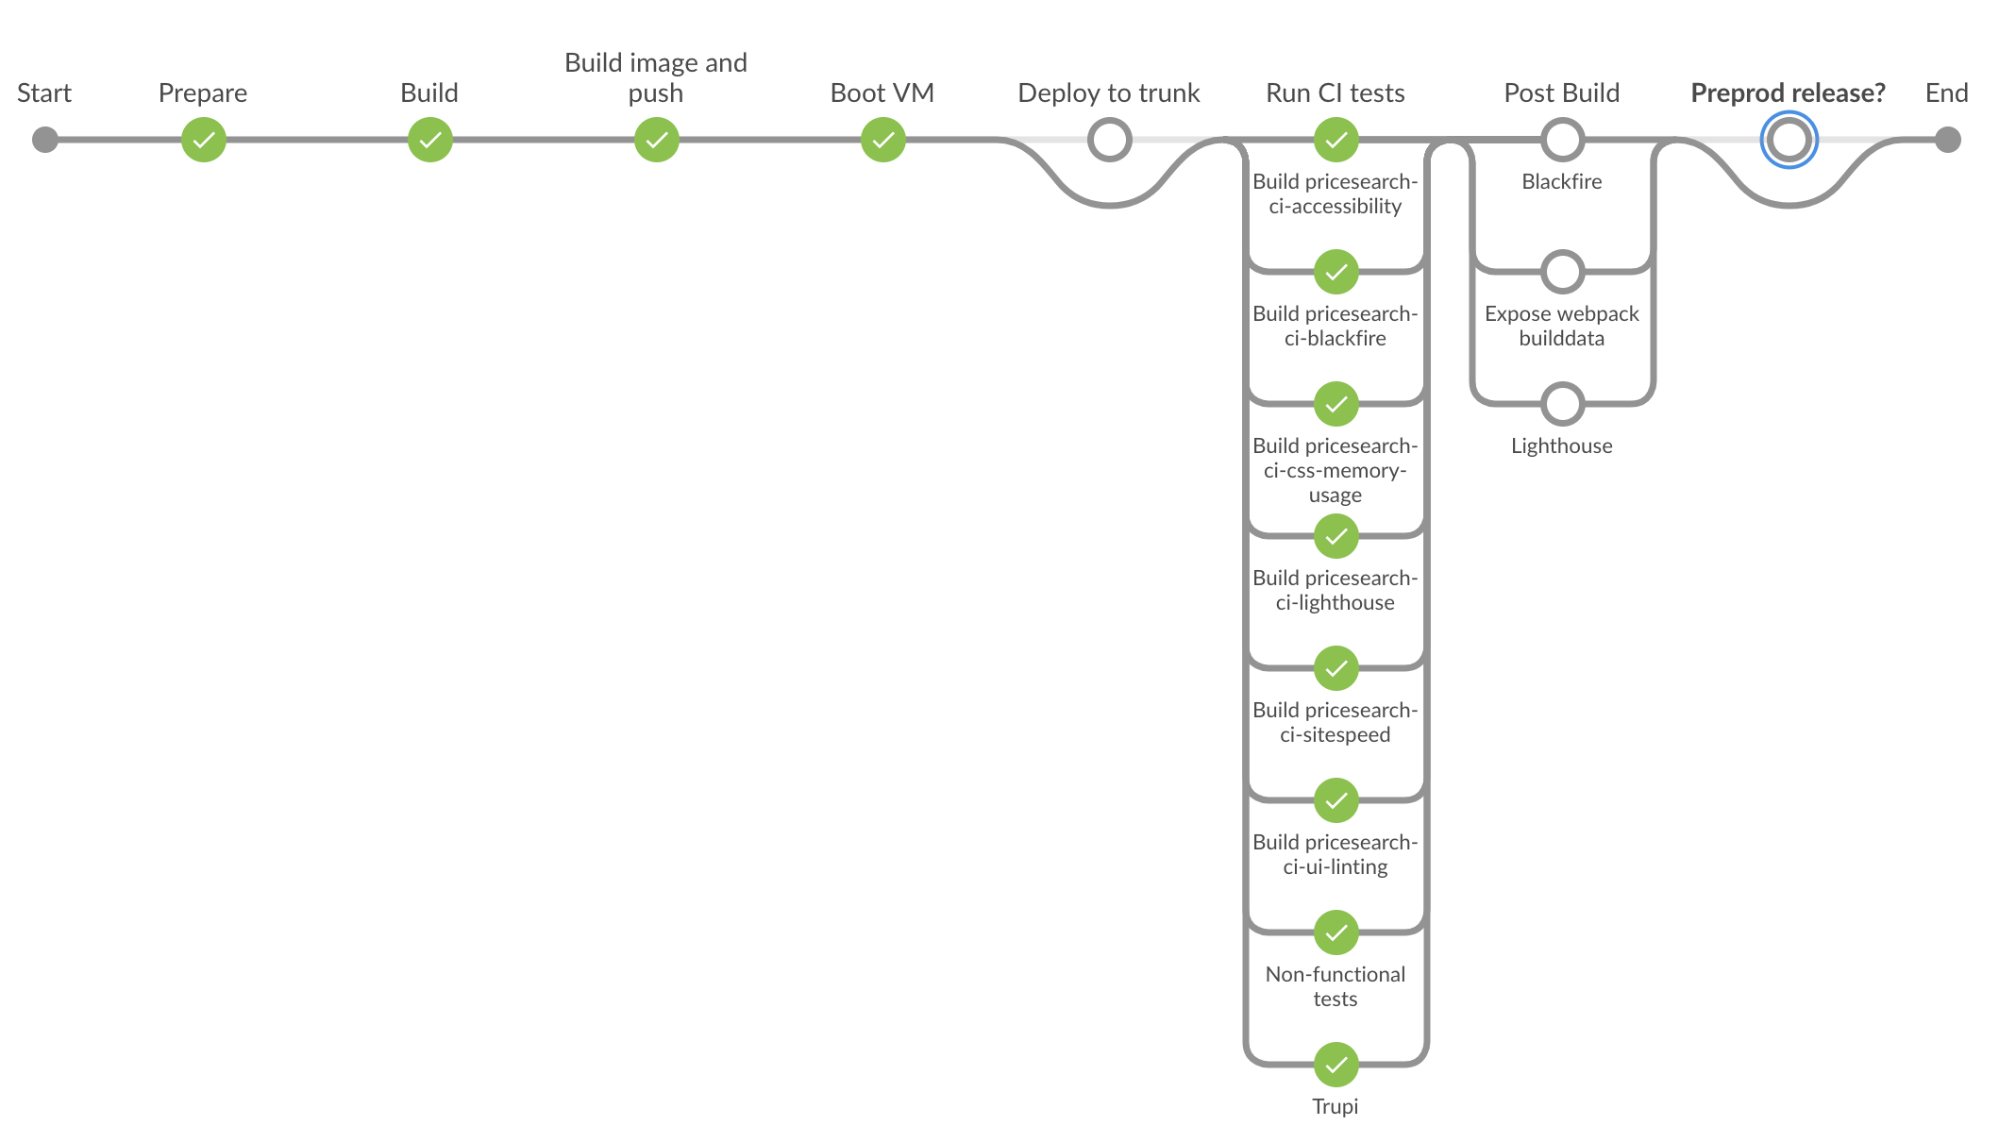
People with a keen eye have noticed Lighthouse is there twice. The first one is for the Hydra CI step which stores results only in our metrics database. The last one is for master-builds. We keep those reports on Jenkins. For Blackfire, it’s almost the same: the first is a “profile”, the second is a “build” for commits to master. Blackfire builds allow you to compare your site’s performance with the historical values collected by Blackfire.
Hydra’s tests
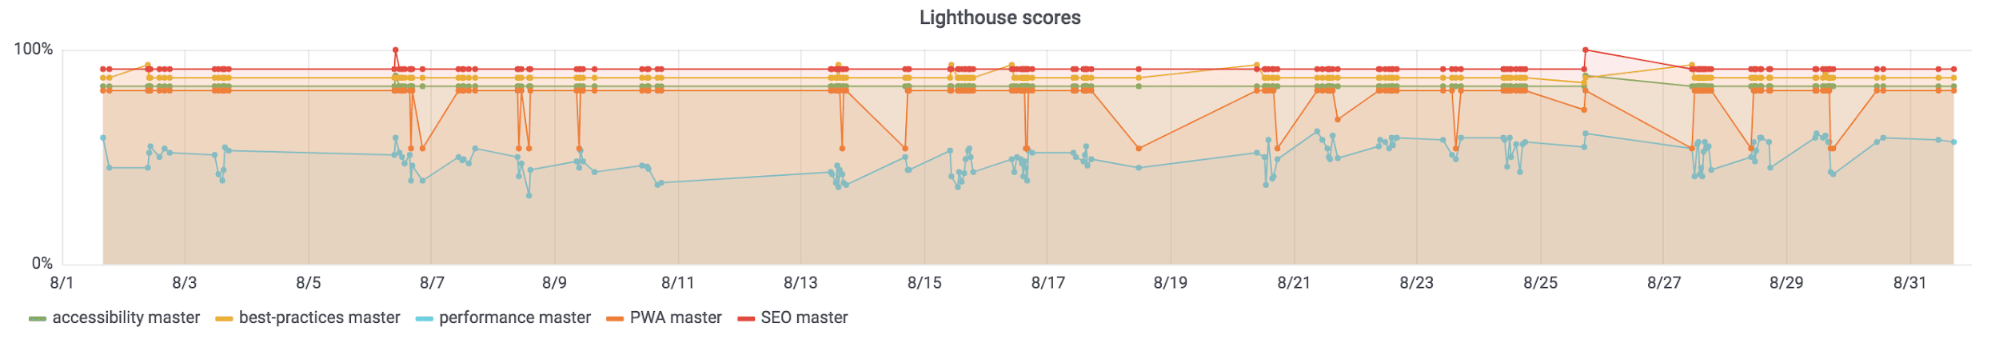
Non-functional tests come in many flavours. Some can’t be categorised, or multiple categories apply to them. One example of such a tool is Google’s Lighthouse. This tool outputs scores for metrics like performance, SEO, PWA (Progressive Web App), accessibility and best-practices. The aggregated scores per topic give a good indication of how well our site is scoring. This quick overview has earned Lighthouse the top spot in our graphing overview.
Accessibility
We want to provide a good experience for everyone who uses our site to compare hotels. This means making sure the site is accessible. For this, we use three tools: tenon.io, the open-source pa11y and a custom, Selenium-based checker to make sure that our most important user flow is still navigable by keyboard.
Performance
Front-end
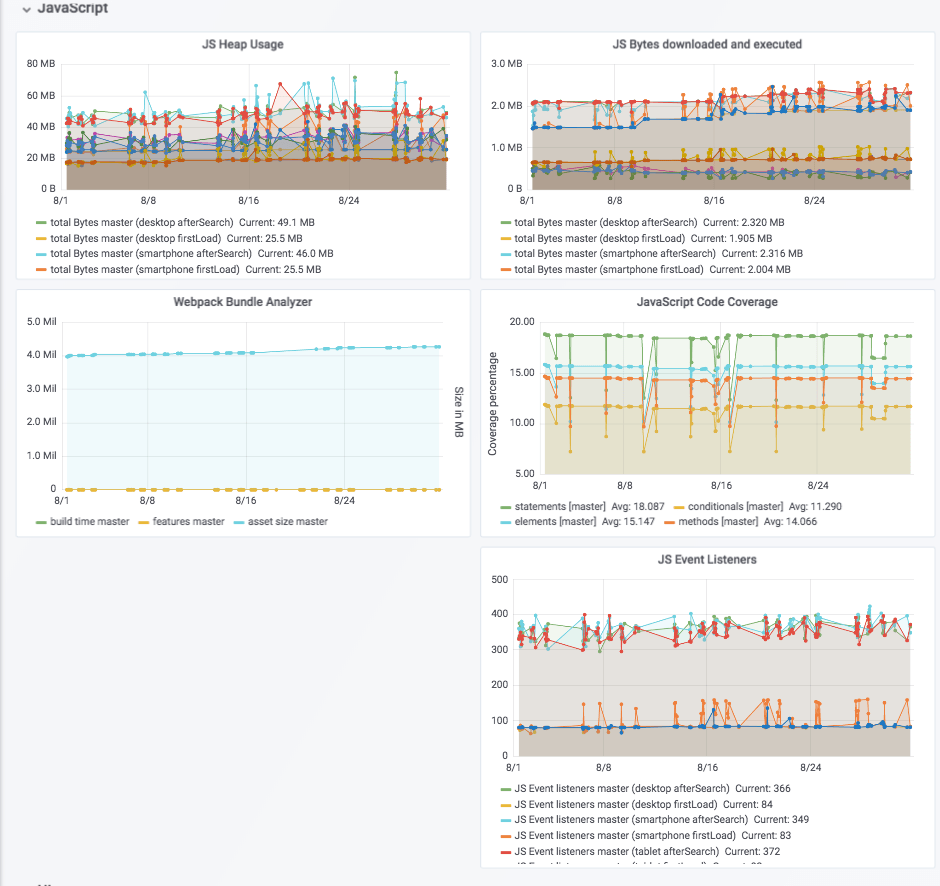
trivago is an SPA, a single-page application. We use a lot of JavaScript. A lot of our traffic comes from mobile browsers, so keeping an eye on metrics of features that might not work well on older, less powerful devices is important. For this reason, we have created a custom puppeteer script that gives us the output of the JavaScript memory heap consumption. It also keeps track of event handlers and the downloaded vs used bytes of JS and CSS.
On the UI side, we set-up a budget for sitespeed.io. We store the resulting reports in Amazon’s S3. sitespeed.io’s metrics are not sent to the graphs, but the final result is exposed as a build badge.
Back-end
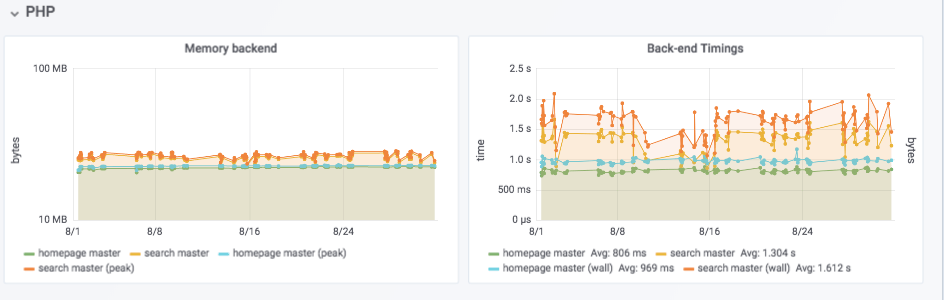
Blackfire.io is a full-stack PHP profiler/tracing system. It generates call graphs and attaches useful metadata like CPU time, used memory, database queries and more. We use it to optimize our back-end code and architecture. During the tests, we create “profiles” of a few important pages. We extract a subset of the data out of the resulting JSON and send it to InfluxDB for storage.
Performance improvements that we’ve made thanks to Blackfire can, for example, be seen in our memcached post.
Other tests
Code gets read many times more than written, so good and consistent readability is important. Because of this, we make heavy use of static analysis tools. We use a customised twigcs to check our Twig files for styleguide violations, and Stylelint for our SCSS.
jest outputs JavaScript code coverage metrics. Webpack Bundle Analyzer Webpack Bundle Analyzer provides valuable insights on our build times and bundle sizes.
Measuring the impact of features in an A/B-testing world
A/B tests, or even multi-variate tests, are a good way to figure out what really improves your site.
trivago uses this technique too. With Hydra, we activate the tests by looking at the branch name of the commit, extracting the test ID and then running a command to enable it for that particular testing session with a GET-parameter or an extra header. This means that you can really see the impact that your feature is having on the metrics.
Storing and visualising the metrics
All the data needs to be stored somewhere. You want to query it in an easy way too. For this, we use the InfluxDB time series database. It integrates nicely with Grafana, our preferred dashboard solution.
Closing the loop: exposing the test results
Tests are useless if the results aren’t used. While we can’t force developers to actively look at pages, we do expose the data in an easy way: as build badges in Bitbucket, our version control system.
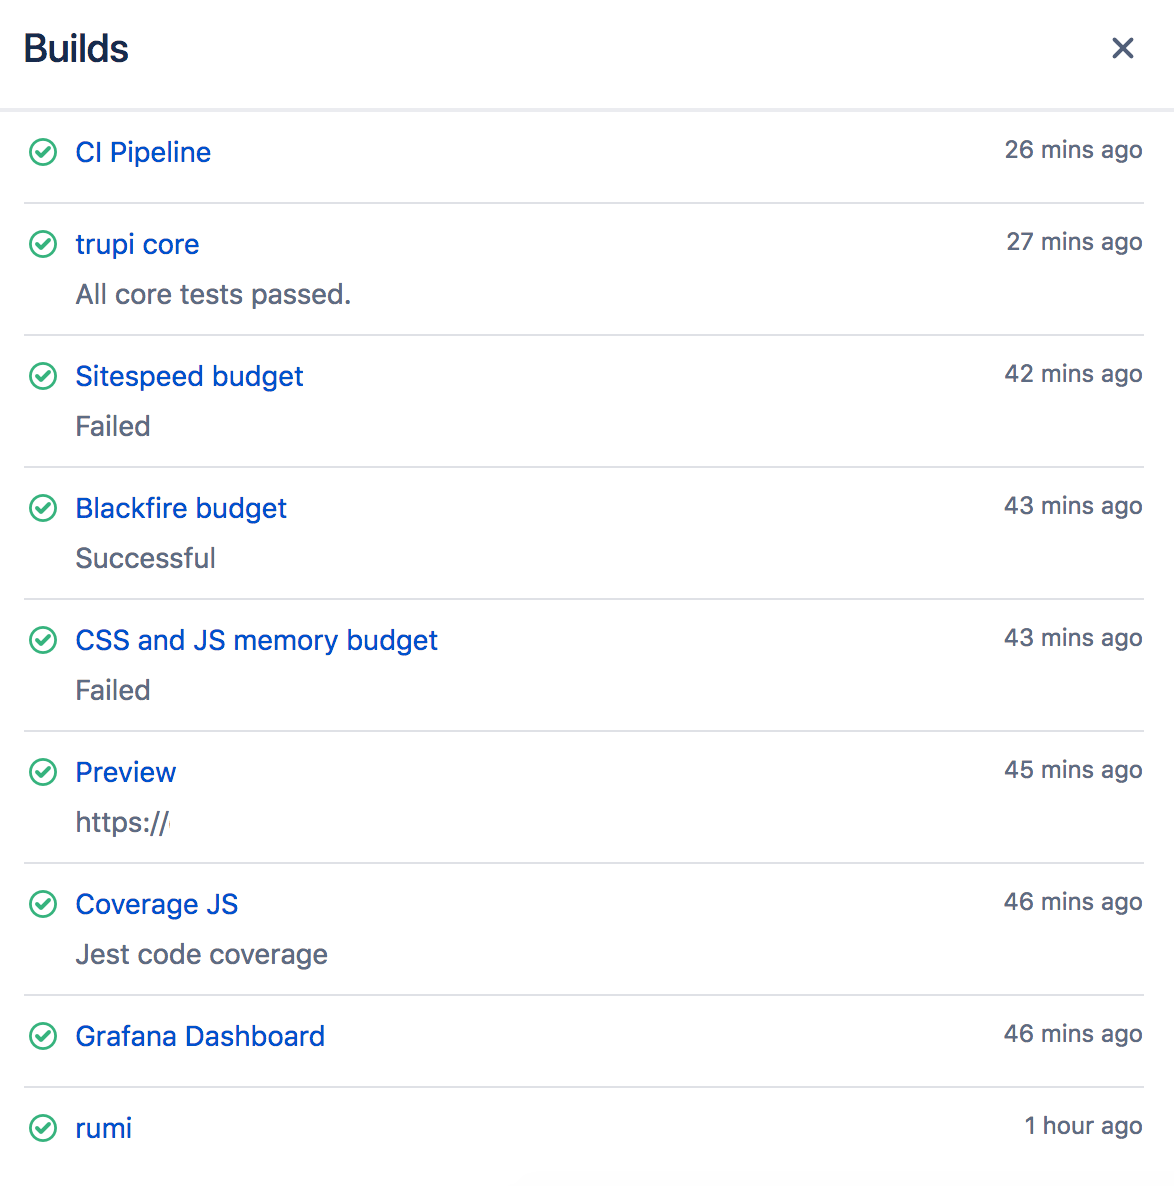
The results of some passing tests in the image above are listed as “failed”. The reason is that Bitbucket does not support informational build badges yet. We also don’t want to block the build for most failures of non-functional tests — for the moment — so we have to use the successful build badge. This will change in the near future.
We show the result status of tests where it makes sense and provide links to detail pages, or to overviews of graphs to track the metrics over time. You can also use the Grafana graphs to compare different branches.

Build badges can also quickly be looked at by QA. You can choose to impose merging policies that prevent code to be merged if not all the tests are successful.
Results
Visibility is key. Without a base line, you can’t see issues and you can’t improve. Having the graphs and build badges to inform us about regressions is an important step and we hope to see more benefits in the future.
Thanks to Hydra we were already able to
- notice a trend of increasing JavaScript usage and be able to discuss the remedies in our JS Guild
- monitor the difference between our current master branch and a new major overhaul of our front-end and back-end code and architecture
The main focus of Hydra is currently to provide awareness. Anything that makes our job easier to catch regressions before the code gets released, is welcome.
Summary
In order to achieve non-functional testing on a per-commit basis, we had to:
- Scale the Jenkins build system;
- Move the build to Docker to get rid of build-machine dependencies;
- Combine the production build code with a web server Docker image;
- Scale the resulting containers in a cloud system, in our case Nomad;
- Inject run-time configuration like passwords;
- Run the various tests in parallel as part of the build pipeline;
- Expose the results in a clear and concise way for developers and QA via build badges and graphs.

Follow us on