tl;dr: continuously monitor your CDN and origin servers on layer 3 with tools like MTR. Layer 3 issues on external middleware can have a significant impact on layer 7 web performance.
In a recent rollout of a new cloud service, we monitored the impact of this service on web performance, UX and business metrics. For all cloud regions and origin servers, we had Synthetic and Real User Monitoring for our site in place.
This data became crucial when business metrics came back negative only for one particular region and origin server while other regions were showing positive results: we saw that the API of the new cloud service in that region was returning responses significantly slower and that users had a higher tendency to bounce.
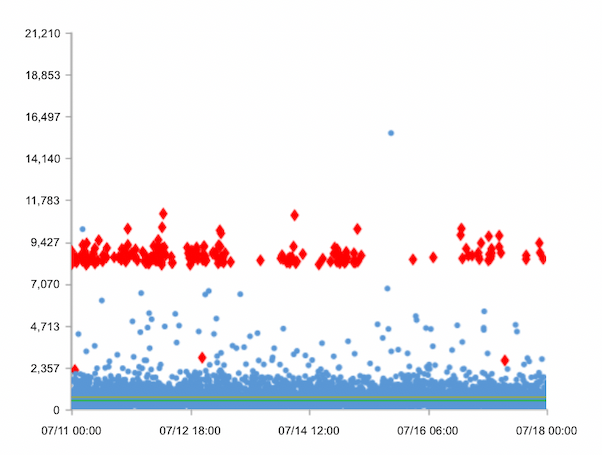
We increased test coverage of the new service by adding high-frequency object tests in addition to our full-page tests. These showed that the cloud service in this region had intermittent outages that were caught by neither Synthetic and RUM tests nor alerting. In the follow-up analysis we discovered that the origin server became infrequently unreachable. Since neither CDN nor origin server were showing any incidents, we initially were confused by these inexplicable periods of Origin unreachability.
The turning point came when we began testing this “first mile” of CDN to origin connection with MTR: we discovered middleware routers in between CDN and origin server that showed 10%-100% package loss. This explained the intermittent outages because if a middleware router had 100% package loss at the time of a test, the origin server would appear to be down.
However, it also offered an explanation for the slower web performance: when package loss is larger than 0%, TCP uses “Automatic Repeat Request” (ARQ) to try and resend packages for which it didn’t receive ACKs. While the exact timings at which TCP should attempt such retries are not covered by the RFC and are influenced by available TCP Extensions such as “SACK”, we may assume a time window of several hundred milliseconds in which TCP attempts resends.
Have a look at the following table for a comparison of web performance metrics from healthy tests compared to tests including and excluding failed connections (n=6048):
| Response | DNS | Connect | Wait | Receive | |
| Baseline | 388ms | 191ms | 14ms | 140ms | 2ms |
| Tests incl. Failures | 986ms | 197ms | 15ms | 717ms | 3ms |
| Tests excl. Failures | 703ms | 198ms | 14ms | 435ms | 3ms |
Average “Connect” and “Receive” times appear unaffected by the outages. This is because they can only be measured if a TCP connection has been successfully established. For all failures, their value would be void. DNS also appears to be unaffected. This is because DNS is commonly resolved over UDP.
However, the “Response” time, which is the time it took from the request being issued to receiving the last byte, and “Wait” time, which is the time between connection established and receiving the first data, are both heavily impacted.
When comparing Baseline versus tests excluding failures, we see the hidden cost of the unhealthy network route: users wait 2x as long for a response, increasing the “Wait” time by over 300ms. This has a severe impact on user behavior on trivago. Check out wpostats.com to understand the business impact that 300ms can have.
After discovering the unhealthy middleware routers, we worked with our CDN vendor to contact the ISP responsible for this hardware so that the issue could be resolved. Sadly, the ISP remained unresponsive, so that we mitigated the issue by switching to an IPv6-only connection for CDN to origin traffic. IPv6 routes are much less congested and our tests showed that on IPv6, the unhealthy hardware we had experienced on IPv4 was not involved. Now, finally having a healthy route from CDN to origin server in all regions globally, we were able to qualify the new cloud service and improve our tech stack.

Follow us on