On a normal day, we ingest a lot of data into our ELK clusters (~6TB across all of our data centers). This is mostly operational data (logs) from different components in our infrastructure. This data ranges from purely technical info (logs from our services) to data about which pages our users are loading (intersection between business and technical data).
At trivago, we use Kafka as a central hub for moving data between our systems (including logs). We also use Protocol Buffers extensively for encoding the data and enforcing a contract between producers and consumers. My team wrote a protocol buffers codec for Logstash that it is extensively used (and maintained) in our setup.
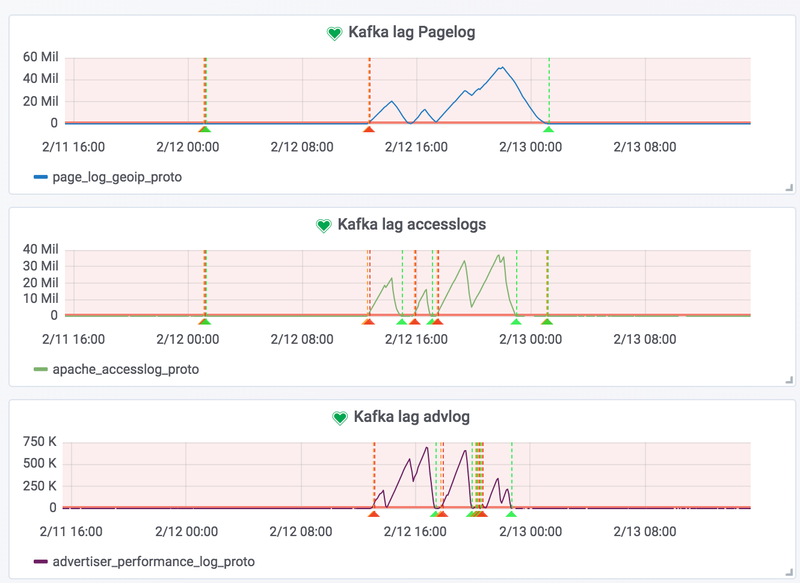
At the end of last year, on a normal Tuesday, we got notified that the lag of some of our Logstash consumers processing data from some critical Kafka topics was increasing. Data was not being ingested into Elasticsearch, and our client nodes were dropping out of the cluster.
Going through our Logstash logs confirmed the issue:
[ERROR][logstash.outputs.elasticsearch] Attempted to send a bulk request to elasticsearch'
but Elasticsearch appears to be unreachable or down! {:error_message=>"Elasticsearch
Unreachable: [http://127.0.0.1:9200/][Manticore::SocketTimeout] Read timed out",
:class=>"LogStash::Outputs::ElasticSearch::HttpClient::Pool::HostUnreachableError",
:will_retry_in_seconds=>16}
[ERROR][logstash.outputs.elasticsearch] Attempted to send a bulk request to elasticsearch,
but no there are no living connections in the connection pool. Perhaps Elasticsearch is
unreachable or down? {:error_message=>"No Available connections",
:class=>"LogStash::Outputs::ElasticSearch::HttpClient::Pool::NoConnectionAvailableError",
:will_retry_in_seconds=>2}
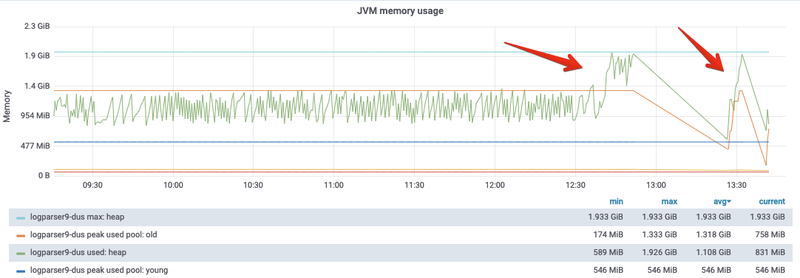
Besides that, the Elasticsearch logs also showed that the client nodes were running out of memory and that the garbage collection cycles were taking too long:
[WARN ][o.e.m.j.JvmGcMonitorService] [logparser10-dus] [gc][352] overhead, spent [10.3s]
collecting in the last [10.3s]
[WARN ][o.e.m.j.JvmGcMonitorService] [logparser10-dus] [gc][353] overhead, spent [1.6s]
collecting in the last [1.6s]
[ERROR][o.e.b.ElasticsearchUncaughtExceptionHandler] [logparser10-dus] fatal error in
thread [Thread-8], exiting
java.lang.OutOfMemoryError: Java heap space
[ERROR][o.e.ExceptionsHelper     ] [logparser10-dus] fatal error
       At
org.elasticsearch.ExceptionsHelper.lambda$maybeDieOnAnotherThread$2(ExceptionsHel
er.java:264)
       at java.util.Optional.ifPresent(Optional.java:159)
       At
org.elasticsearch.ExceptionsHelper.maybeDieOnAnotherThread(ExceptionsHelper.java:254)
       At
org.elasticsearch.transport.netty4.Netty4MessageChannelHandler.exceptionCaught(Netty4
essageChannelHandler.java:74)
       At
io.netty.channel.AbstractChannelHandlerContext.invokeExceptionCaught(AbstractChannel
andlerContext.java:285)
       At
io.netty.channel.AbstractChannelHandlerContext.invokeExceptionCaught(AbstractChannel
andlerContext.java:264)
       At
io.netty.channel.AbstractChannelHandlerContext.fireExceptionCaught(AbstractChannelHan
lerContext.java:256)
We use the Prometheuselasticsearch exporter for monitoring our Elasticsearch infrastructure. Our monitoring data confirmed the issue. Restarting the affected client node only kept the instances alive for a few minutes, and after that, the same pattern of errors would emerge.
Allocating more memory to our client nodes only slightly increased the time that the node would remain healthy, indicating that this was a symptom and not the root cause of the incident.
Logstash logs showed that the cluster was rejecting write/bulk requests before the client nodes became unhealthy:
[INFO ][logstash.outputs.elasticsearch] Retrying individual bulk actions that failed or were
rejected by the previous bulk request. {:count=>1}
[INFO ][logstash.outputs.elasticsearch] retrying failed action with response code: 429
({"type"=>"es_rejected_execution_exception", "reason"=>"rejected execution of processing
of [2376771431][indices:data/write/bulk[s][p]]: request: BulkShardRequest
[[accesslogs][0]] containing [index
{[accesslogs][logs][XGKuBTP@VP5eU9UdskUgLAAAAAM], source[n/a, actual
length: [2.5kb], max length: 2kb]}], target allocation id: cuS8lFYZSP2PZQKu8vltaA, primary
term: 1 on EsThreadPoolExecutor[name: elastic-storage7/write, queue capacity: 1000,
org.elasticsearch.common.util.concurrent.EsThreadPoolExecutor@62d1e48f[Running, pool
size: 24, active threads: 24, queued tasks: 1000, completed tasks: 2343795117]]"})
When an Elasticsearch cluster starts to reject write operations (under normal circumstances), it could mean that the cluster cannot cope with the write load anymore. In practice, this can happen because of many different reasons. But we can agree that it is never a good sign.
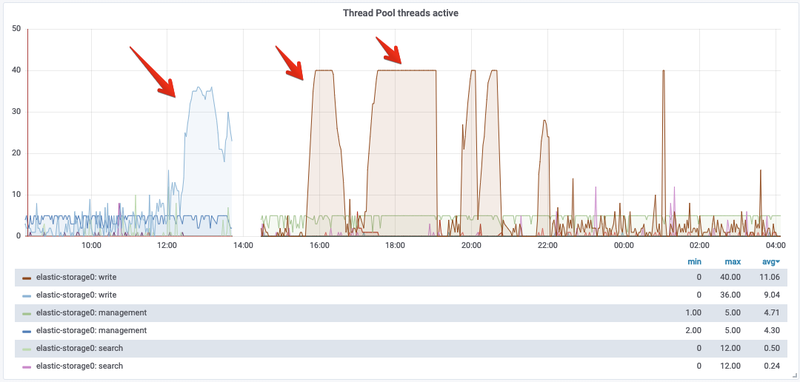
Inspecting the monitoring data available in our dashboards, we noticed that the storage nodes in our cluster were hitting the maximum number of active write threads. This means that all threads in the write thread pool were being used.
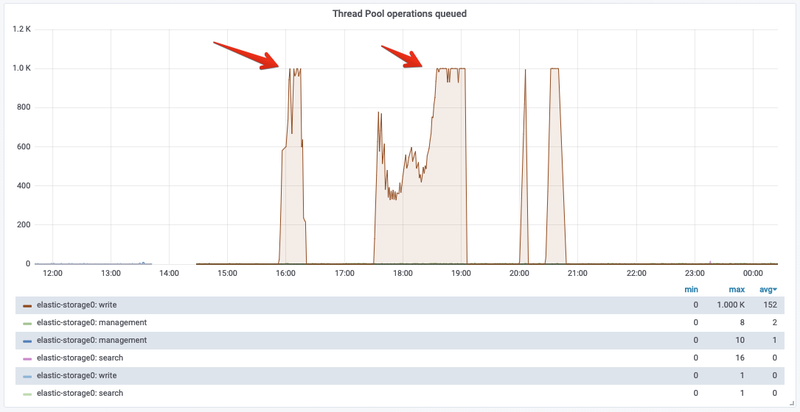
As expected, at the same time the data nodes would start to queue a lot of write operations until the limit (1000) is reached.
Looking at this data, we concluded that we saw a manifestation of a field mapping explosion:
Defining too many fields in an index can lead to a mapping explosion, which can cause out of memory errors and difficult situations to recover from.
Consider a situation where every new document inserted introduces new fields, such is the case with dynamic mapping enabled. Each new field has to be added to the index mapping, which can become a problem as the mapping grows.
Immediately we moved to the next questions: How and why?
After going through the recent changes to our logstash configuration repository, we noticed that a new instance was deployed to ingest data from a new Kafka topic into Elasticsearch. We do this on a fairly regular basis, so this action doesn’t indicate an immediate problem. Nevertheless, checking the index’s mapping revealed an alarmingly high number of fields.
This particular logstash instance was ingesting protobuf encoded data that included a nested map field. The data in this field looked like this:
{
 "map_field": [
   {"1": 1}
   {"200": 4}
   {"315": 9}
   {"100": 16}
   {"201": 25}
   {"612": 36}
 ]
}
Elasticsearch supports nested objects, but this particular dataset is very problematic. The nested/object type will create a field for each unique key of map_field. In the previous example, the key is dynamic, which means that internally Elasticsearch will create a lot of new fields for every new document.
The recommended way of structuring the data in these cases is to use a nested object like:
{
 "map_field": [
   {"key": "1", "value": 1}
   {"key": "200", "value": 4}
   {"key": "315", "value": 9}
   {"key": "100", "value": 16}
   {"key": "201", "value": 25}
 ]
}
Although it might seem like a more verbose representation of the data, Elasticsearch will only need to create two new fields map_field.key and map_field.value and the cardinality (number of different values) of the field will not matter anymore, because what changes is the value of the field and not the name of the field.
Elasticsearch limits the total number of fields that an index can have (1000 by default). This limit makes perfect sense if not all the fields are created at the same time. In our case, new fields were created almost constantly due to the cardinality of map_field.
Every time that a new key was found in a document, the mapping of the index needed to be updated. Updating the mapping for an index is a heavy operation. Taking a look at the pending_tasks endpoint of Elasticsearch, we could see that the put-mappings actions were queuing:
GET _cat/pending_tasks?v=trueinsertOrder timeInQueue priority source
9432 26.1s HIGH put-mapping [cr]
9433 26.1s HIGH put-mapping [cr]
9434 26.1s HIGH put-mapping [cr]
9435 26.1s HIGH put-mapping [cr]
9438 26.1s HIGH put-mapping [cr]
9439 26.1s HIGH put-mapping [cr]
9436 26.1s HIGH put-mapping [cr]The put-mapping tasks have a higher priority, so they are processed before the rest of the write/bulk operations, but they still count against the write thread pool size/limit.
The high number of mapping updates combined with the high cardinality of the nested field caused a lot of extra activity in our data nodes. Especially if we consider that the mapping is part of the cluster state that is sent to all nodes. Eventually, the queue was filled and the data nodes couldn’t write anymore.
In recent versions, Elasticsearch introduced a new flattened datatype to deal with object fields with a large or unknown number of unique keys. When a field is declared as flattened, the entire object will be mapped as a single field. This approach could be very useful when the format of ingested data is difficult to change.
Conclusion
This incident showed us that sometimes small changes in how your data is structured could have a massive impact on the availability and health of an Elasticsearch cluster. In this particular case, a seemingly normal looking field affected the entire cluster and slowed down (eventually stopped) data ingestion for all topics. Needless to say that we keep an eye on those map fields now when we add new topics/indices to our cluster.
We decided to add an alert for a couple of metrics: the number of active write threads and the number of queued write operations. Adding alerts after our normal incident review process is not common: We don’t want to have too many alerts. Nevertheless, these two metrics provide a good view of the cluster’s health (from a data ingestion perspective). If the cluster starts to queue write operations or uses all the threads in the write pool, it usually indicates that the cluster is struggling to keep up with the data ingestion and it is best to investigate.


Follow us on