Metrics are one of the main building blocks in the topic of observability.
Hence, we have a lot of metrics within our applications and especially for the connections between our applications. Every outgoing request has its latency measured and we also record the sizes of the request and the response. These numbers are collected in histograms and based on that data, in our Grafana graphs, we create corresponding graphs that show us e.g. the median size of request- and response payloads or the 99th percentile of call durations.
This story is about an incident where we tried to find and fix a problem that we saw in these metrics. We went down a rabbit hole, only to discover that the metrics were correct all along.
In one of our applications (called “Processor” because naming things is hard) we recently added a feature which was supposed to reduce the number of hotel ids in requests made to another system (“Fetcher”) by removing some ids that were effectively ignored on that system. This removal is done by calling a third system (“Refiner”) and having that one only return the valid hotel ids.
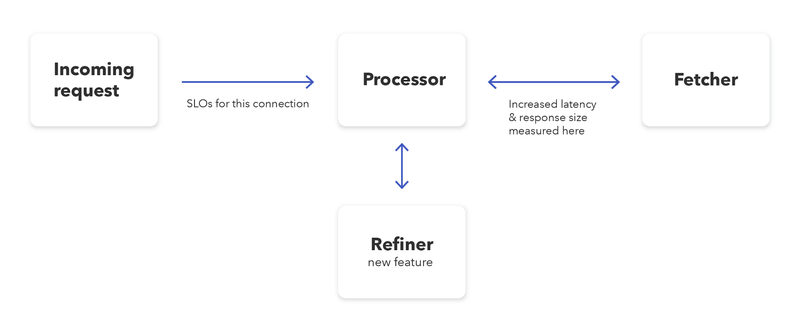
It was a rather straightforward implementation which was hidden behind a feature toggle, and checks on our testing and staging environments gave us confidence that everything worked as expected. We proceeded to activate the feature on our production systems.
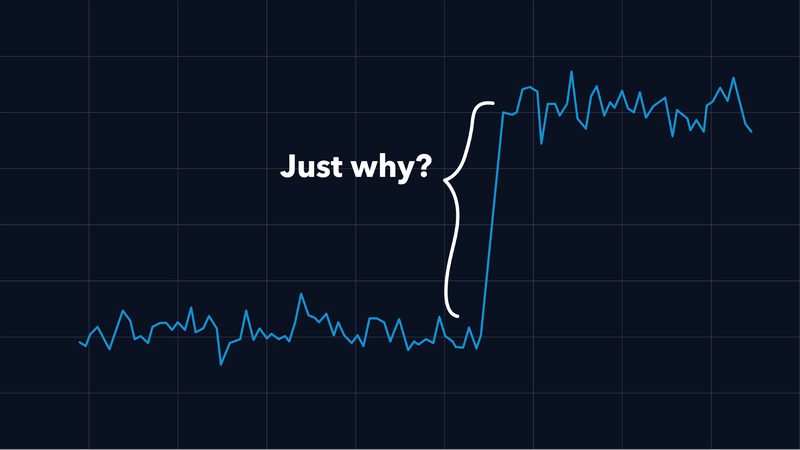
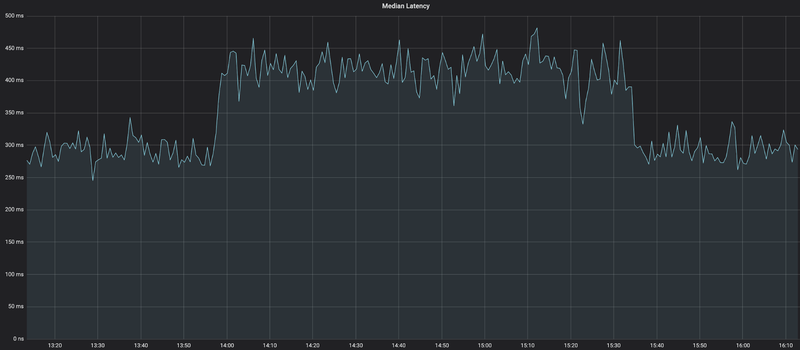
As soon as the feature was active, something unexpected happened in the metrics: The median latency of the requests - which were supposed to be smaller in size and hence faster to process - increased by as much as 30%, from a consistent ~310ms to a consistent ~410ms. Luckily, we could simply deactivate the feature again.
We were baffled.
How could a feature that was supposed to only decrease the number of requested hotel ids lead to an increase in the latency between Processor and Fetcher?
To figure this out, we went down the rabbit hole.
First, we wanted to make sure that our feature indeed only ever reduced the size of the request. We looked at the code and at our tests, trying to find edge-cases that we missed. But no matter which scenario we envisioned, the implementation seemed correct, and we only added more metrics and logging in order to catch any situation in which the code did not do what we expected. All those logs confirmed that we never had an increase in the request size, and we concluded that the feature did exactly what it was supposed to do.
While investigating everything on the code level, we also looked at other related metrics. As we use istio as a service mesh, we have many metrics around network traffic between our systems. It didn’t take us too long to find out that the median response size had also increased by a factor of 10-20x!
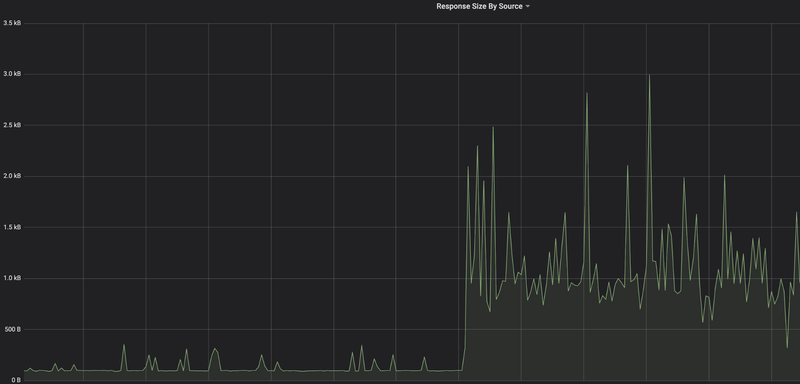
This was even more confusing. We were absolutely sure that the reduced requests would only ever be a subset of what we requested without the feature. Effectively, the responses should never be bigger than before.
Now focusing on the response size, we continued our investigation. From now on, we followed a strict hypothesis-based approach. All interested people gathered in a dedicated Slack channel and whoever had a theory about the issue would post the theory, together with ways to prove or disprove it. Some of the hypotheses that we came up with:
- The new feature calls “Refiner”, so istio might have an overall limit of outgoing connections from one instance and apply some circuit breaking with retries, leading to an increase in latency.
- We might hit some CPU limits because of the additional work done in the new feature, which slows down the serialization and deserialization of the requests, leading to higher latencies.
- Some thread pools might be saturated, leading to longer processing times.
There were even more ideas, but none of them could explain the increased latency and we started to question if our efforts were actually worth our time. From a business perspective, the feature did what it was supposed to do and none of our clients complained about any problems. Our Service Level Objectives (SLOs) of “Processor” were unaffected, and so we decided to let it be.
At least, that was our plan. Everybody knows how good software engineers are at letting go of interesting, hard-to-debug issues …

We agreed to investigate one final idea: What if we assume that the numbers in the metrics are correct now, but they were wrong before?
We took a step back and had a look at the original requirements: The goal of the feature is to filter out hotel ids from the request which effectively don’t do anything on the target system. Such ids are now removed before they are sent to “Fetcher” and, consequently, no data is returned for these ids. This also means that the requests which actually are sent towards “Fetcher” all require actual work and do produce actual responses.
This led to our hypothesis: If we had many fast requests that contained many hotel ids without actual data in the responses before, all our metrics were skewed towards lower latencies and smaller responses. Removing these “useless” requests meant that we would not record those ridiculously fast, small responses anymore.
Now, knowing what to look for, it was easy enough to find more metrics that confirmed this hypothesis. So finally, after several days of concerted effort, we found the root cause for the change in metrics! The change was actually for the better and the graphs we looked at until then were not telling us the whole truth.
We are big fans of blameless post mortems at trivago, we even have a regular, internal conference full of such post mortems. Although there was no negative effect of this “incident”, the structure of such post mortems gives a good way to review the whole investigation:
What went well?
- The change in the metrics was discovered quickly.
- Using a feature toggle allowed us to easily verify the reason for the impact and to validate different hypotheses by toggling the switch whenever needed.
- Having the end-to-end responsibility for our systems inside our team, and centralized metrics and logging allowed us to investigate the topic from different angles because we knew where to find all relevant data.
- A working build and deploy process with short turnaround times enabled us to add metrics and logs to our production deployments quickly.
What did not go well?
- We did not fully understand our metrics. Especially percentiles and histograms only tell you the truth that you extract from them.
- Instead of relying on our unaffected SLOs, we spent a considerable amount of time on investigations.
Where did we get lucky?
- Our users were not affected at all.
- It turned out not to be a real issue.
After all, we were mainly relieved that the metrics now show us even more reliable numbers than before. And in the future, we will definitely take more care to understand our metrics better!

Follow us on