In 2020 we started to migrate one of our most significant workloads, our Node.js based GraphQL API and many of its microservices, from our datacenter to Google Kubernetes Engine. We deploy it in three GCP regions, each having its Kubernetes cluster. Since then, our monitoring infrastructure has changed due to various periods of instability and pandemic induced scaling challenges.
Initial setup
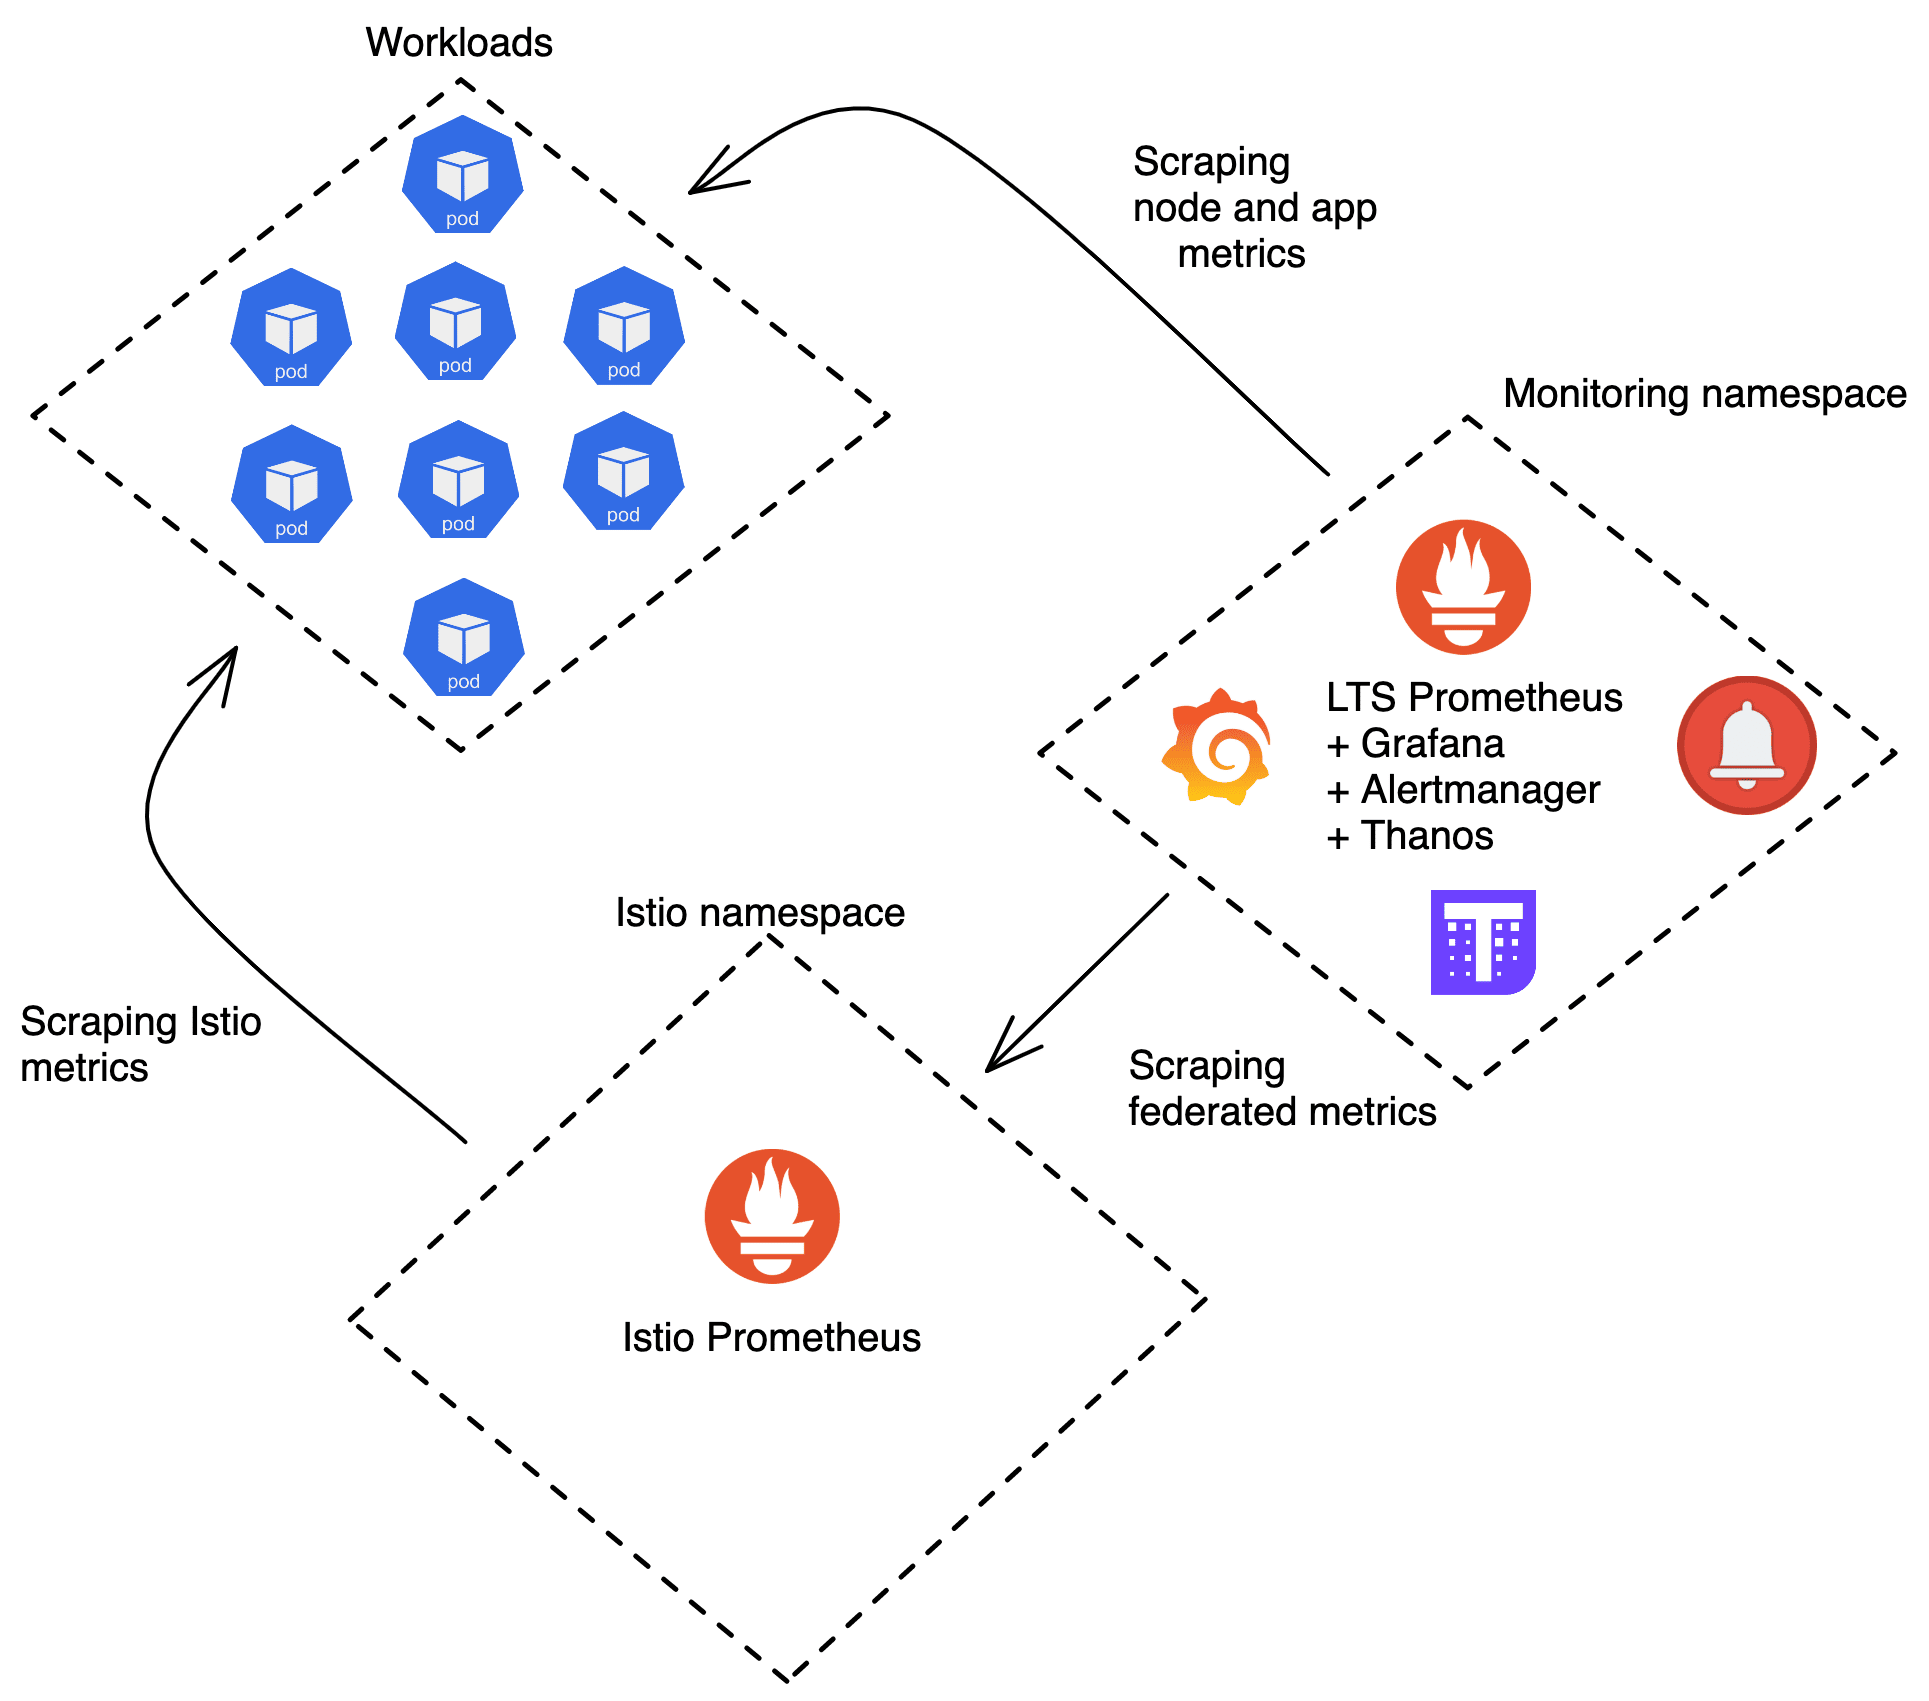
Our initial setup was based on Prometheus Operator with one of these components each per cluster:
- Istio as a service mesh to collect network traffic metrics
- a Prometheus instance, deployed by Istio Operator, to scrape all Istio sidecars and evaluate workload aggregation rules, itself being scraped by our LTS Prometheus
- a Long Term Storage (LTS) Prometheus instance, handling all our ServiceMonitors, PodMonitors, and PrometheusRule objects, with a Thanos sidecar to store metrics in a Google Cloud Storage (GCS) bucket
- a Thanos Store to serve the metrics from our GCS bucket
- a Thanos Query to query both Prometheis and the Thanos Store at the same time
- an Alertmanager
To have a central point for inspecting metrics from all clusters, we deployed additional components to a single cluster:
- a “global” Thanos Query instance, querying the Thanos Query instances in all clusters
- a Grafana instance, which uses the global Thanos Query instance as data source

We’ve had previous experience with a different Grafana/Prometheus setups where each namespace had its own Grafana/Prometheus instance. These instances were not interconnected which meant we had to constantly switch between different browser tabs to compare data across regions. Since one of our goals was to offer a central access point for our metrics, adding Thanos Query to all clusters and regions was a perfect solution.
Adding a Thanos Query instance to query all clusters and regions next to our Grafana instance was a natural decision. And then adding Thanos Store for long-term metric storage showed to be straight forward, too.
First problems
In the spring of 2021 our main workload, the GraphQL API, saw increasing requests as people returned to travel, due to COVID-19 restrictions being lifted. Around June we were running with around 1000 GraphQL pods per region during peak time. We use HorizontalPodAutoscaler (HPA) to adjust deployment size depending on the load. On top of that, we practice continuous deployment, leading to many releases per day.
Concretely, with 3000 or more unique pods in 3 hours (roughly our effective Prometheus retention period), we were creating loads of unique metric labels, leading to ultra high cardinality of Prometheus metrics. Needless to say, the system was under a lot of stress.
Throw more resources at it
Our first approach to stabilize the situation, was to throw more resources at it:
-  retention: 2h
-  scrapeInterval: 10s
-  memory: 1000Mi
+  retention: 1h
+  scrapeInterval: 15s
+  memory: 25000Mi
During one of the first incidents at night we reduced the scraping interval and increased allocated memory. This improved the situation — now Prometheus took six hours to run out of memory instead of just one.
Because we used Thanos to persist metrics, we only had very short loss of data during the restarts when Prometheus wasn’t available to scrape new metrics. But the next morning we kept looking for more ways to reduce the load on Prometheus.
HPA stabilization window
Kubernetes HPA helps us to adjust our deployment size to the current load. We noticed a very shaky amount of pods for our workloads where the HPA would scale down briefly and then scale back up. The chart below illustrates this problem on one of our smaller workloads.

These new pods would have new names that would end up as unique label values in Prometheus. In order to reduce the amount of these, we tuned the HPAs downscaling stabilization window. By increasing it, we managed to smoothen the chart. Scale down events are less frequent now, and therefore the cardinality of metrics is not growing as quickly as before.
 apiVersion: autoscaling/v2beta2
 kind: HorizontalPodAutoscaler
 metadata:
 # [...]
 spec:
     scaleTargetRef:
 # [...]
     metrics:
 # [...]
+    behavior:
+      scaleDown:
+        stabilizationWindowSeconds: 480
+        policies:
+        - type: Pods
+          value: 1
+          periodSeconds: 60
Labels cardinality reduction
In order to reduce Prometheus memory usage, we decided to drop some labels. Looking at the TSDB Status page (/tsdb-status) of one of our Prometheus instances, we found one of the labels with the highest cardinality was the label pod that simply contained the pod name.
Istio ServiceMonitor (scrapes metrics from Istio sidecars):
 apiVersion: monitoring.coreos.com/v1
 kind: ServiceMonitor
 metadata:
 # [...]
 spec:
   selector:
 # [...]
   endpoints:
   - path: /stats/prometheus
     targetPort: 15090
     interval: {{ .Values.istioPrometheus.scrapeInterval }}
     relabelings:
 # [...]
+    - action: labeldrop
+      regex: "pod"
Istio reports metrics based on the source and destination of requests. That’s useful, but leads to duplication of the data collected for cluster internal traffic (the same request is being recorded on the outgoing and incoming proxy). We decided to drop the metrics on the destination side, leaving just the “source” part of it. Our reasoning being that for traffic originating outside of our cluster, our Istio Ingress Gateways still publish “source” metrics, but for traffic leaving our cluster we don’t have any part measuring the “destination” side. Also, during network issues, it’s more likely that the source metrics are more accurate than the destination ones.
To accomplished this we added one more entry to the Istio ServiceMonitor:
+    - sourceLabels: ["reporter"]
+      regex: "destination"
+      action: drop
We also dropped all envoy internal metrics since we weren’t using them:
+    - sourceLabels: [__name__]
+      regex: "^envoy_.*"
+      action: drop
We realized that we were able to remove some labels on the Envoy level already. This led to less work and processing to the overall monitoring stack since labels were discarded earlier.
This is a set of labels that we decided to remove from envoy:
Istio profile:
 apiVersion: install.istio.io/v1alpha1
 kind: IstioOperator
 metadata:
   name: istio-profile
   namespace: istio-system
 spec:
   values:
 # [...]
     telemetry:
       v2:
         prometheus:
           configOverride:
             inboundSidecar:
 # [...]
+            outboundSidecar:
+              debug: false
+              stat_prefix: istio
+              metrics:
+                - # Remove these tags from all metrics
+                  tags_to_remove:
+                    - "destination_canonical_service"
+                    - "source_canonical_service"
+                    - "destination_principal"
+                    - "source_principal"
+                    - "connection_security_policy"
+                    - "source_version"
+                    - "destination_version"
+                    - "request_protocol"
+                    - "source_canonical_revision"
+                    - "destination_canonical_revision"
+                - name: request_bytes
+                  tags_to_remove:
+                    - "response_code"
+                    - "response_flags"
+                - name: response_bytes
+                  tags_to_remove:
+                    - "response_code"
+                    - "response_flags"
+            gateway:
+              debug: false
+              stat_prefix: istio
+              metrics:
+                - # Remove these tags from all metrics
+                  tags_to_remove:
+                    - "destination_canonical_service"
+                    - "source_canonical_service"
+                    - "destination_principal"
+                    - "source_principal"
+                    - "connection_security_policy"
+                    - "source_version"
+                    - "destination_version"
+                    - "request_protocol"
+                    - "source_canonical_revision"
+                    - "destination_canonical_revision"
+                - name: request_bytes
+                  tags_to_remove:
+                    - "response_code"
+                    - "response_flags"
+                - name: response_bytes
+                  tags_to_remove:
+                    - "response_code"
+                    - "response_flags"
+                - name: request_duration_milliseconds
+                  dimensions:
+                    request_origin: "string(has(request.headers.origin) ? request.headers.origin:'')"
+                    tags_to_remove:
+                      - "response_code"
+                      - "response_flags"
Separate node pool
Due to the different nature of our monitoring workloads we decided to introduce a new Kubernetes node pool. Our unstable GraphQL workloads impacted stability of monitoring pods, leading to 100% memory saturation on some nodes and out-of-memory events that killed Prometheus processes. The last thing that we wanted to experience was broken monitoring infrastructure during ongoing incidents.
The CPU and memory requirements of the infrastructure node pool were very different compared to the workload node pool where we ran our GraphQL servers. Separating the two allowed us to optimize resource allocation specifically to each pool, making resource usage more efficient and lowering our monthly bill.
Prometheus sharding
We arrived at the conclusion that we had to think about horizontal scaling of the load. Initially, we came up with a creative way of splitting Istio Prometheus load to multiple instances.
We used the following relabelling configuration in Prometheus:
relabelings:
    - source_labels: [__address__]
      modulus:       2
      target_label:  __tmp_hash
      action:        hashmod
    - source_labels: [__tmp_hash]
# for prometheus instance 1:
      regex:         ^0$
# for prometheus instance 2:
#     regex:         ^1$
      action:        keep
This manual approach allowed us to reduce load on a single Prometheus instance by 50%. That was a very big improvement for us.
In December 2020 the Prometheus Operator added native support for sharding. This enabled us to use a simple configuration flag to control the number of Prometheus shards we wanted to run. Since then we shard both the Istio and LTS Prometheus, reducing the resource consumption per instance. This allowed us to spread the Prometheus work over multiple nodes and stabilize our deployment.
Distributed alerts
When distributing the scraping over multiple Prometheus shards, we had alerts trigger on some of them, that checked for absence of any traffic to our API. Turns out that when you use a hash to distribute your work, some Prometheus instances might end up without any targets of your API. So naturally they also don’t see any traffic, and the alerts trigger as they should.
Alert queries that we couldn’t rewrite to work with just the local metrics in each Prometheus shard were moved to Thanos Ruler. With the Prometheus Operator it was as easy as changing the labels of the PrometheusRule with the alert so it would match the ruleSelector of our ThanosRuler instance.
Current situation
We currently have 40 Prometheus instances, each using about 2.5GiB of memory, scraping between 3000 and 5000 unique pods over a day, depending on the amount of releases that day.
Since moving some alerts to Thanos Ruler almost a year ago, we didn’t have any issues with their reliability in our setup. But if you decide to go with a similar setup, it’s definitely worth it to understand the risks involved.

Follow us on