Introduction
While working with data and analyzing the interactions of our users with the products we have today, it is essential to understand their behaviors by tracking their past actions, such as opening notifications, interacting with a blog, or creating a new login in the platform. In that context, the attribution study refers to the method of grouping together all of those actions in a specific pattern to generate one desired end result.
In the scope of this article, our main goal is to generate new active campaigns from our hoteliers in Business Studio.
Before we begin, let’s define the concepts of event, channel, and path. For this article, we will refer to an event as any type of user interaction with one of the company’s products, which was tracked and registered in our database. This could be multiple types of activities, such as viewing a notification, opening an email, adding a new hotel to the profile or entering the website for the first time.
The channel is the environment where the event is happening, which could be a blog, social media, the main dashboard or any other context that makes sense for the business.
The path is a sequence of events that happen in chronological order, which defines a unique behavior. So if the user has checked the blog, opened an email, and then started a new subscription in the website, we have a path of events such as blog checked > email opened > subscription campaign started.
With that in mind, there is also the idea of attribution of an event. In order to check all of the paths that triggered an event of starting a new campaign, it is necessary to access the historical data behind that and check each event that happened right before this trigger event. However, which and how many events you check before the trigger or how many days before the trigger you check, depends on the business strategy and the choice of the data scientist working with the available information.
Types of Path Attribution
Here I will share some of the most popular and common attribution models and then present an application of the Multi Touch Attribution Model, as well as the simplest way to score the user’s behavior based on the odds of triggering a specific event.
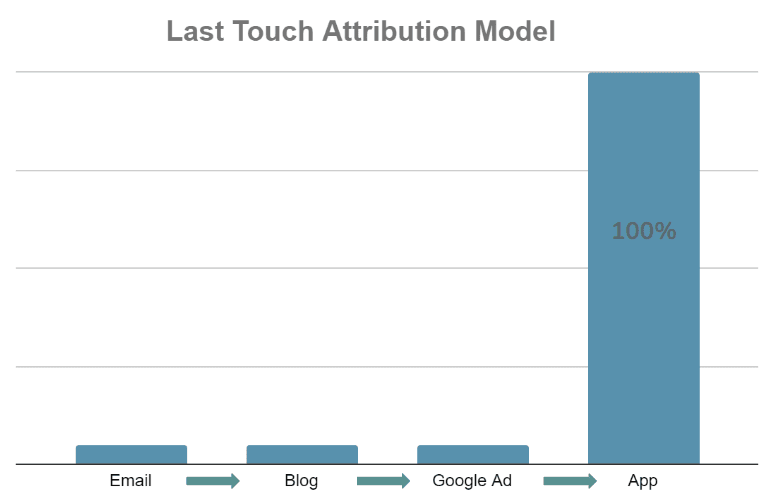
Last Touch Attribution Model
This is the default and the most popular method used for digital marketing. In this case, the attribution for the triggered main event goes to the most recent channel event that happened before it. So, if we consider the trigger event as a purchase of a side product, if the previous tracked event was a click from the user on a Facebook ad, this occurrence will receive 100% of the attribution. This is a good method if you start implementing an attribution model for the first time, specifically if the product you work with has a short purchase cycle, meaning there will be fewer possible past channels to receive the attribution for the triggered main event. The Last Touch Attribution Model is not recommended if the money spent on ads is of high value (more than $50,000 per month). In these instances, there is a tendency to invest in multiple channels, and it would be best to analyze the efficiency of each one in the user’s path, rather than focusing on the last one only. It is also better to avoid this model if the product has a lot of organic traffic or if it has a long purchase cycle.
First Touch Attribution Model
For this type of model, all of the attribution for the cause of the trigger event to happen comes from the first event in the user’s timeline. In the marketing context, an email campaign is started, or an advertisement is set for the user to start an action. If after a few events, they start a new subscription, we consider that the attribution came 100% from the first event. This method works well if you work with a lot of top funnel marketing channels, for example, SEO, blogs, and marketing that involves pulling a large pool of clients into the main website or dashboard of your company.
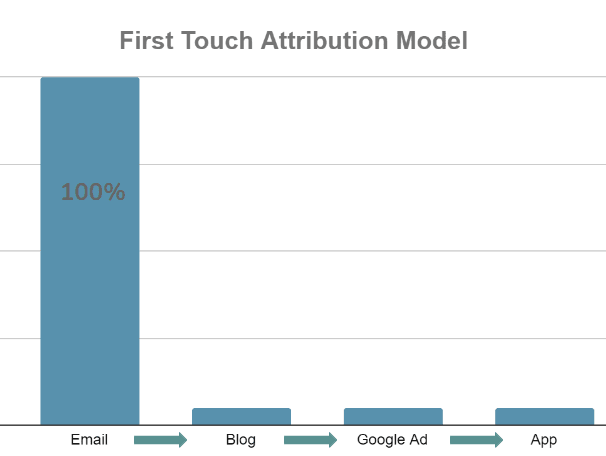
However, the First Touch Attribution Model might not be the best option if you need daily updates on the previous channels and the first interaction between the user and the platform is not as relevant as before. In that situation, the most recent activities are much more pertinent to increase the odds of triggering the main event.
Linear Attribution Model
The linear attribution model gives an equal share of attribution for all previous channels. This means we do not assign any weight to the quantity of an event, or its closeness to the purchase. It is a good model to be used if the product has a very complex purchase cycle. Meaning, it is hard to define the value for each event, or if you are working with very small channels that do not retain much data.
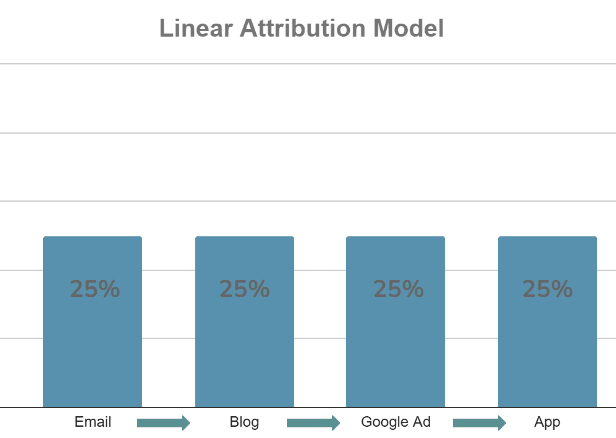
This is not the best choice if there are a few channels more dominant than the others others because the smaller ones would receive more credit than they should. It is also not suggested if there are gaps in the user’s timeline. This means some important events are not being tracked over time and certain channels receive too much credit.
Data Driven: The Multi Touch Attribution Model (Markov Chains)
Now that we know about the most naïve models, let’s go a bit further and learn about the Markov Chains - where we work with statistics and distribute the attribution for each channel and event according to their historical relevance for the final purchase. With that, we have more openings to define a customized rule for attribution according to the specific product ecosystem you are working with. With that in mind, we introduce the concept of Markov Chains. This model involves a chain of channels, where each one is a vertex and the user has a specific probability of moving from one to another.
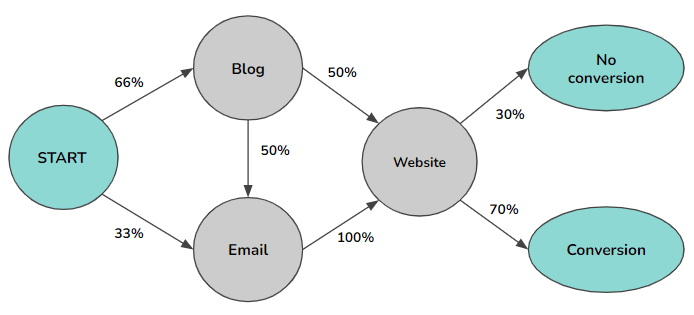
The order of the Markov chains defines how many observations we are looking at before the future one - so in the case of the second order, we are checking two observations.
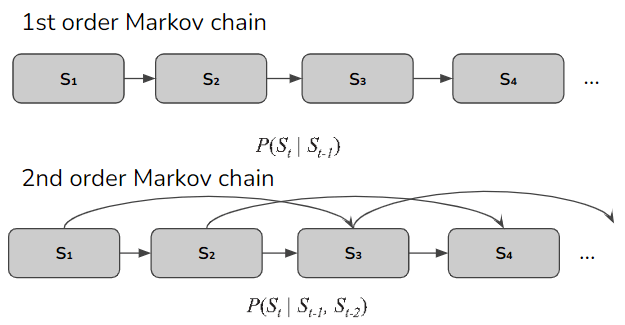
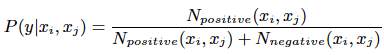
By going deeper into the mathematical concept of the probabilistic model for the second order Markov chains, with the help of a study from Xuhui Shao, we can calculate each channel’s probability based on the number of occurrences of purchase for each sequence of users’ events:
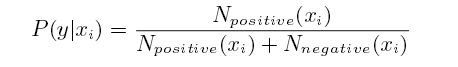
This would bring a result where each sequence of events would be associated with a specific probability of conversion - meaning the odds of a purchase to happen based on that channel’s popularity in the past, from the historical data acquired from previous clients.
As we are working with users’ paths — their combination of events — it is also important to verify the probability for each pair of sequential channels.
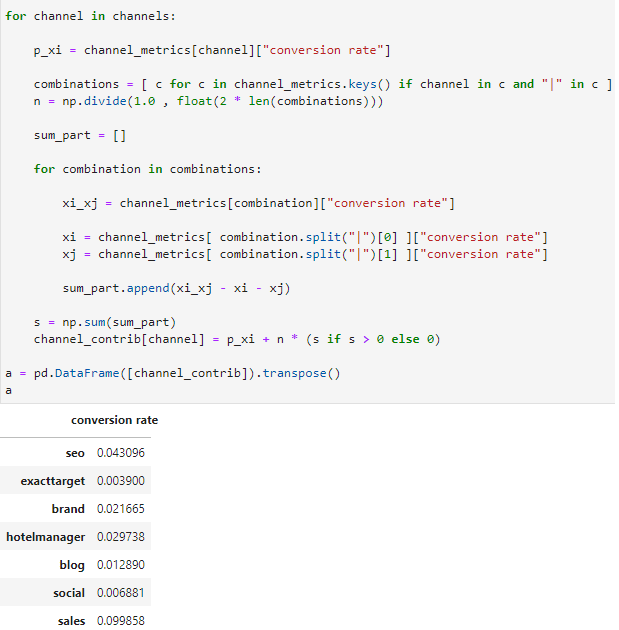
By having the individual channels and the pairwise channel probabilities available, it is now possible to calculate a combination using second-order probability estimation to compute the conversion metric for this Multi Touch Attribution Model:
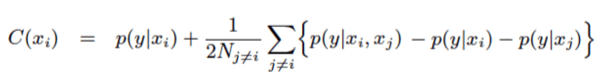
To simplify the understanding of the formula for the calculation of the channel contribution above, it can be broken into two terms. The first term denotes the individual channel probability. The second term considers the contribution from all of the possible pairs with that specific channel - while also subtracting the individual contributions of each so that it considers only the conversion that happened after an interaction with both channels.
The User Conversion Score: Easiest Method to Approach It
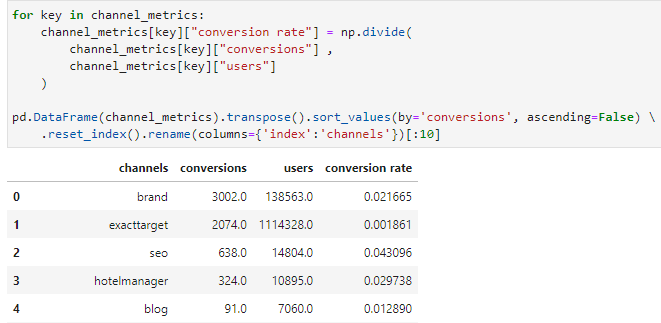
After choosing the model from the options above - with the recommendation of the Markov Chains option for a data-driven approach - it is time to define the user potential based on the values of each of their previous paths. The main idea is to set the score based on their interaction with the platform, as a way to define their probability of purchasing one of the company’s products.
At that moment, if you have stored the information of the value for the contribution of each path and channel in a separate table, it is possible to track and compare the current user’s path and refer to this table, to define the score of the user. The range of this score can be chosen according to the granularity level required for each business case. You may choose, for example, a score between zero and one, which can also be seen as a percentage of the user’s potential, between 0% and 100%.
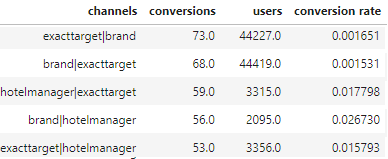
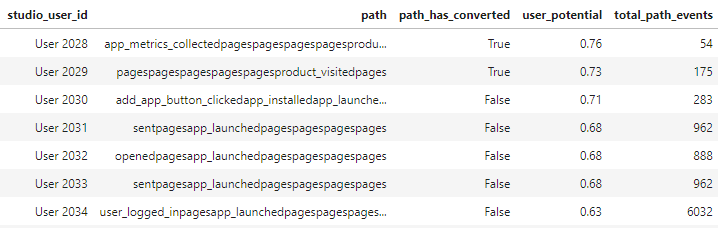
The generated results also include the description of the user’s path and how many times this path occurred previously in our historical database, so we can check the popularity of the events and categorize the user according to their engagement with the product.
Conclusion
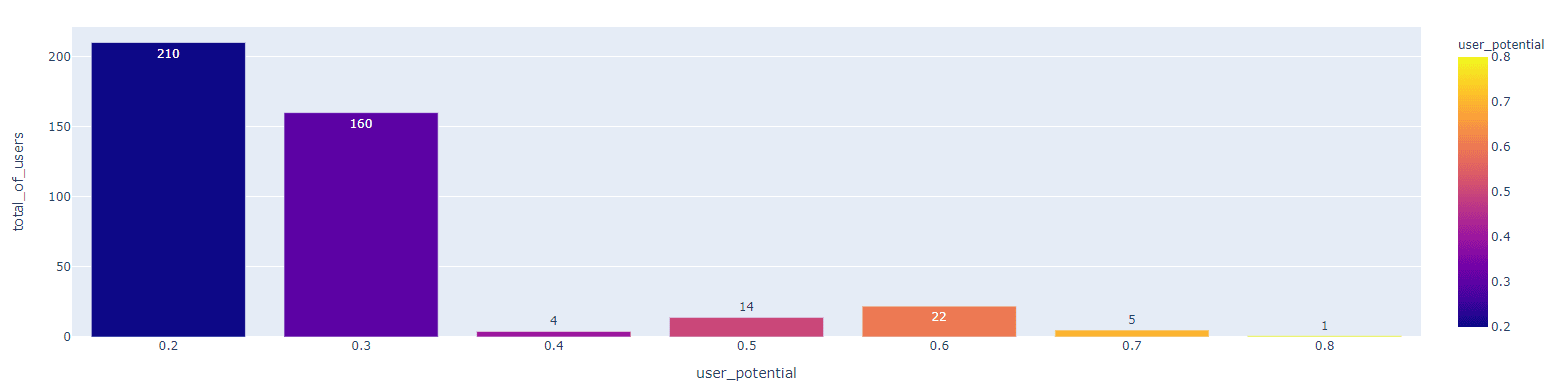
With that result, you can analyze the customer’s interaction with the platform and filter the users according to the marketing strategy by focusing on the ones with a higher potential of purchasing a new product from your venue. In this last example of a marketing campaign that focuses on users with more than 20% of potential, who have not yet made a purchase, we have 210 users in the audience who could be contacted in order to better understand why they haven’t subscribed yet and to recommend the product.

Follow us on