Over the last few years, we completely refactored what was described in our previous article about how we use the ELK stack for an overview of our test automation results, but some core concepts remain valid and applicable.
As we have moved to a Continuous Delivery approach with our new web application with dozens of daily releases of our main product, it has become more crucial to identify the causes of end-to-end test failures. Every day we fight against test flakiness, i.e. failures unrelated to actual defects in the application under test, and have achieved an average success rate of more than 99% on our Selenium-based tests. This means less than 1% of failed tests on stable main branch in the overnight runs, indicating that there are still inevitable occasional failures that might cause uncertainty. It’s a well known problem of UI automation that can happen frequently, especially on a staging environment where we are not mocking any backend service.
In our view, the best answer is to empower every QA engineer or developer to be able to easily and quickly identify if a specific test failure is only related to the branch/PR where it was detected. Good reporting tools and dashboards that allow one to gather an overview of test executions across all repository workflows are therefore essential.
Current setup
Our updated setup for end-to-end test execution, reporting, and monitoring includes:
- GitHub Actions (GHA) workflows
- Custom runners on Google Cloud (GCP) for test jobs
- Cluecumber Maven plugin for test reports generation
- Google Cloud Storage (GCS) bucket for test reports storage
- A test framework plugin that produces Kafka log entries from Cucumber JSON report files
- Kafka message broker
- Logstash for processing Kafka messages
- Elasticsearch for data storage
- Kibana for data visualization and exploration
- Grafana and Slack for alerting on recurring test failures
Test reports storage in the cloud
We previously used in-house Jenkins instances for test executions and the reports generated by the Cluecumber plugin (html pages) could be attached to each job run as artifacts and Jenkins would also serve them as web pages when accessed in a browser. With test execution now triggered through GitHub Actions, and test jobs executed within custom runners on GCP, we needed to find a solution for storing and accessing the test reports. Attaching them as zipped artifacts to each GHA workflow run was the first solution, but it was inconvenient as it required downloading and unzipping each report, also making any direct linking from dashboards more complicated.
We thought about using something already available in the trivago tech stack and specifically opted for leveraging Google Cloud storage by uploading the test reports to a GCS bucket, serving them as web pages through a gcs-proxy application supporting file listing that is inspired by https://GitHub.com/springernature/gcs-proxy. That’s how we created a “test report server” to suit our needs.
After the tests execution is completed, the current test flow involves:
- Logging tests results (from Cucumber JSON files) to Kafka
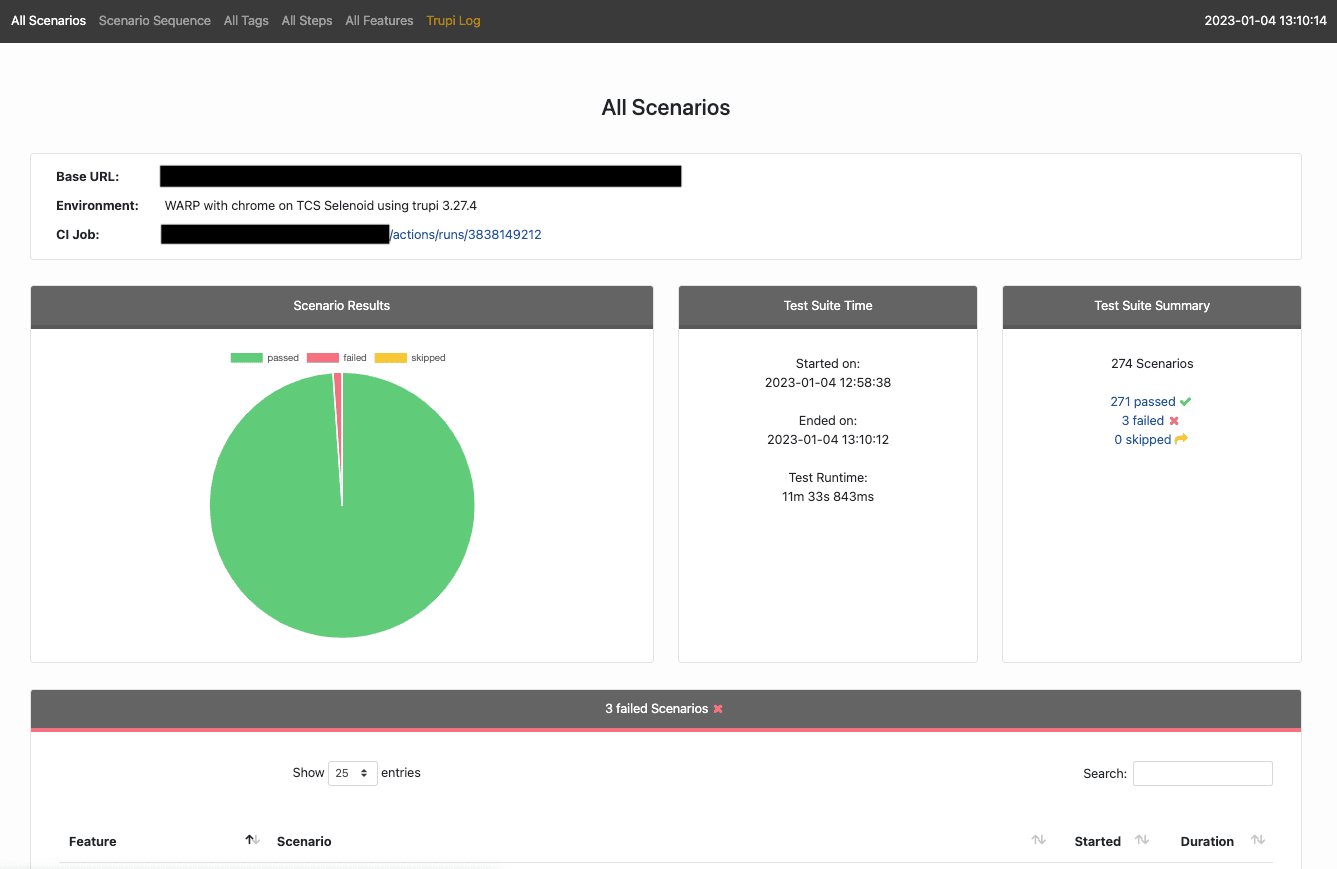
- Generating a test report as a html page with attachments using the Cluecumber plugin
- Uploading the generated test report folder to the “test report server” GCS bucket
- Sharing the link to the test report as a GitHub status badge, comment on a PR, message to Slack etc., based on the workflow requirements.
The upload step is simple and requires running a gsutil command within the GitHub Actions jobs:
name: Upload test report to the GCS Bucket
id: uploadTestReport
if: ${{ always() }}
run: |
  gcloud config set auth/impersonate_service_account serviceaccount-email@our-test-project.iam.gserviceaccount.com
  gsutil -m rsync -r "${{ env.REPORT_LOCAL_PATH }}" "${{ env.DESTINATION_BUCKET }}/${{ GitHub.repository }}/${{ GitHub.workflow }}/${{ GitHub.run_id }}"
We decided to organize the reports by repository, workflow, and run id. This proved very efficient, allowing for easy scale up when more teams within the company started using our test report server for their projects, storing end-to-end and API automated tests reports as well as Webpack bundle analyzer reports.
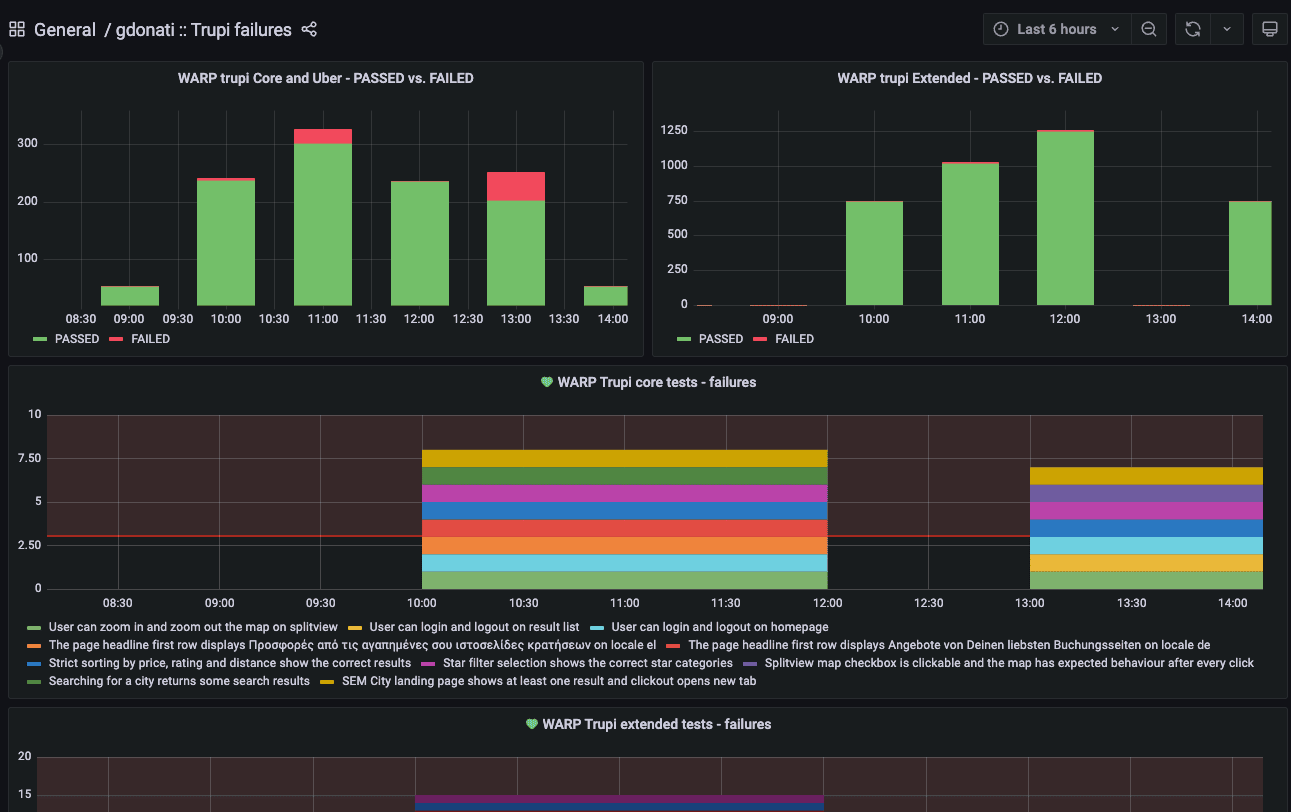
Kibana and Grafana
As logging to Kafka includes the test reports links, we can’t only look at a failure message already within our Kibana dashboards, but also easily reach a complete test report with just one click, immediately accessing steps execution details, screenshots, and video recordings.
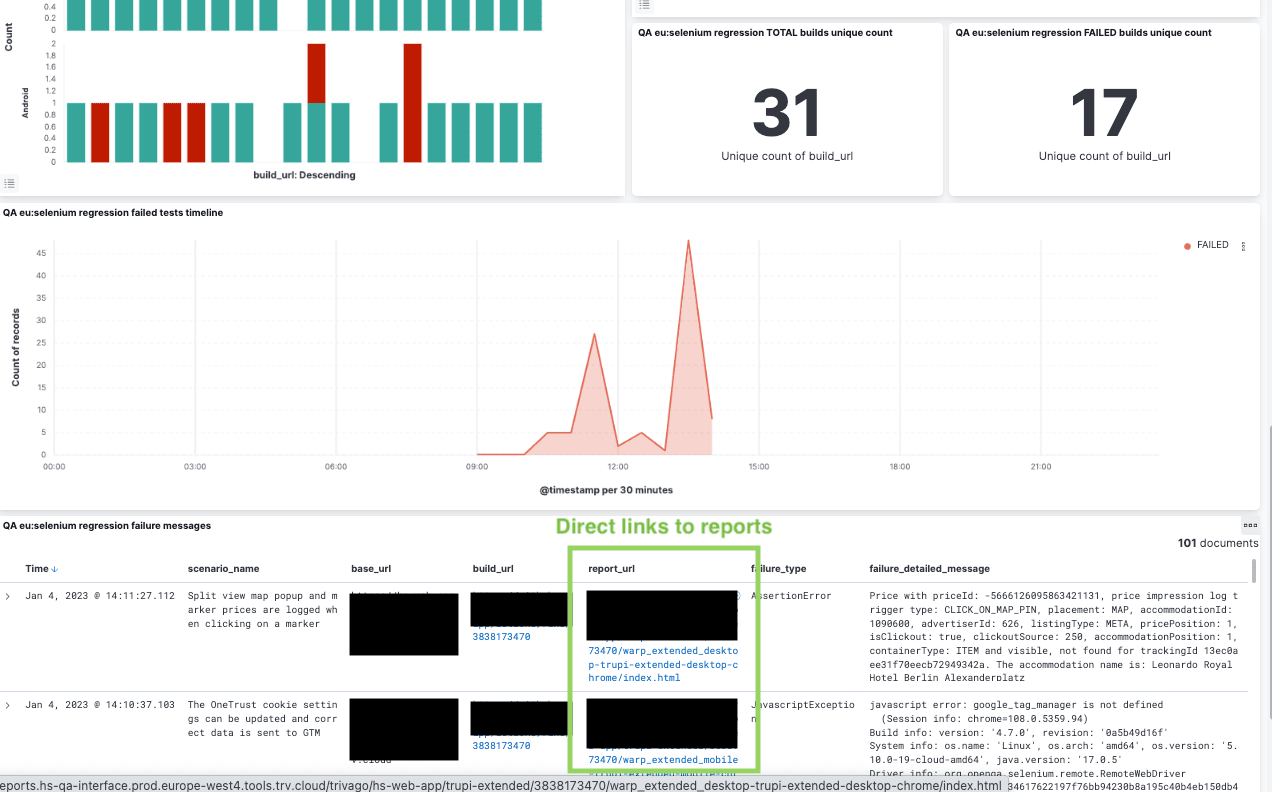
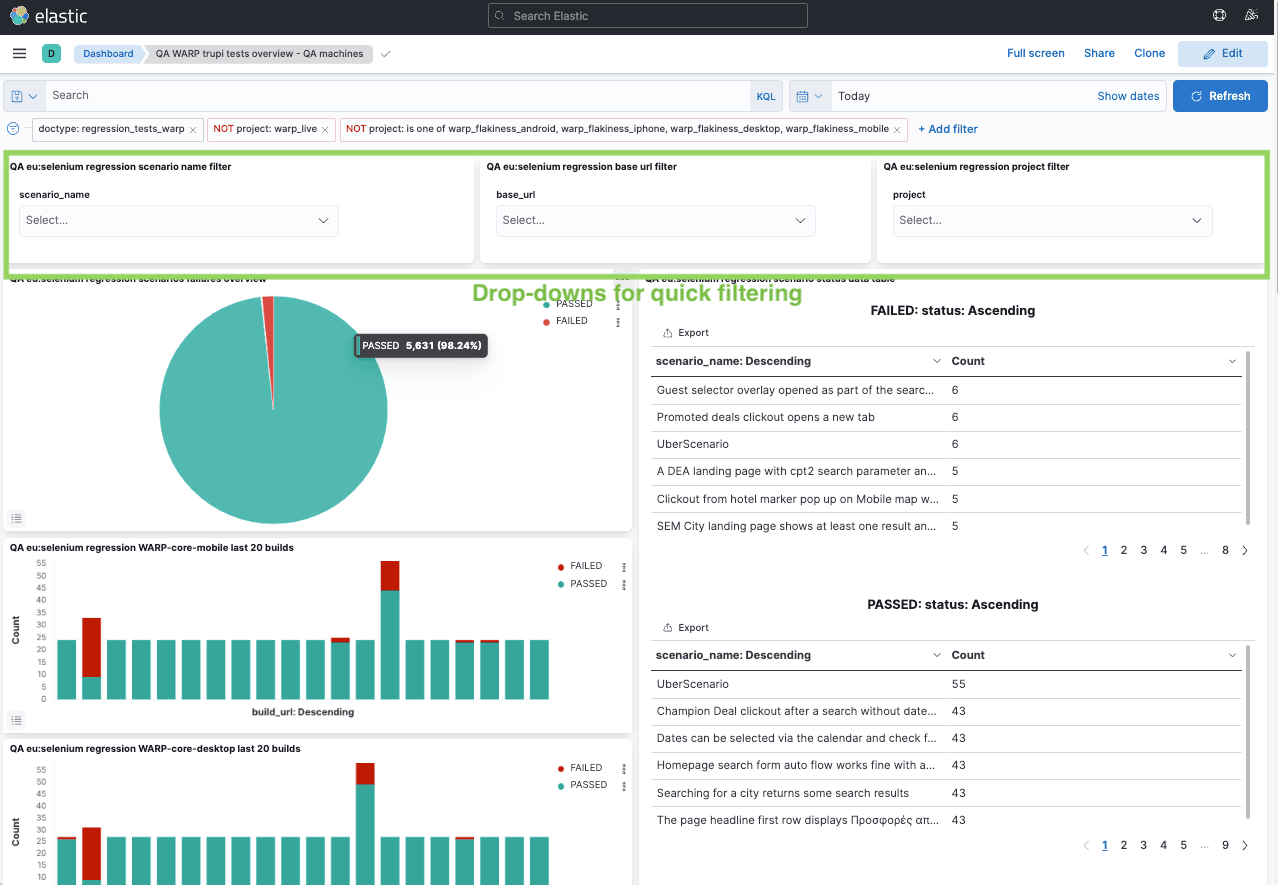
A set of different panels and filters allows each of our QA engineers and developers to quickly focus on a certain branch or test result. We currently have a main template for dashboards, reused for different projects and test workflows, but the availability of multiple fields with detailed data also enables each individual team to build their own dashboards with relevant information and filtering.
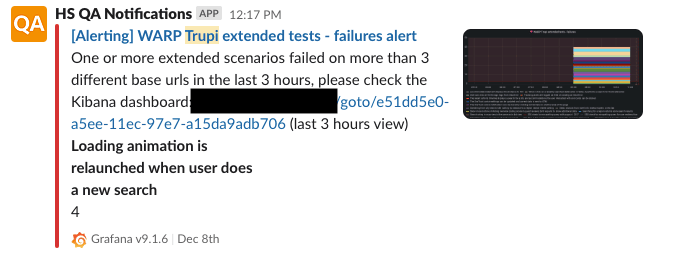
A further recent addition to the existing setup has been to leverage Grafana to trigger notifications to a Slack channel when a single test scenario fails across multiple branches/PRs. This way we can avoid actively scanning for flaky tests during the day and it’s a support to flakiness detection jobs that we run overnight on the application main branch.
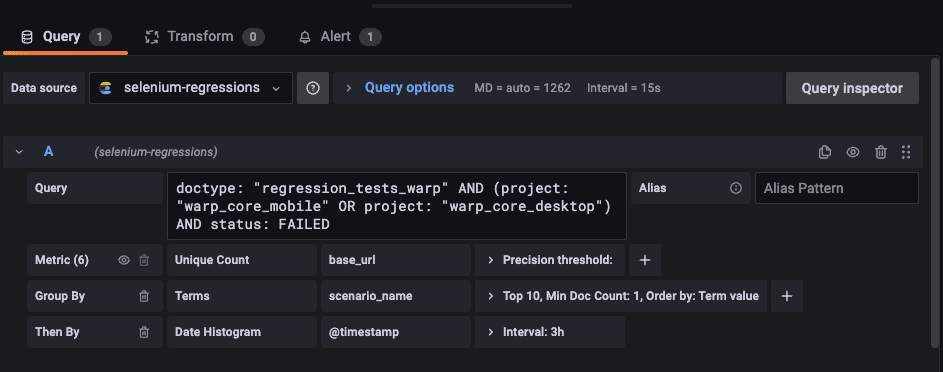
The Grafana queries look like:
doctype: "regression_tests_warp" AND (project: "warp_core_mobile" OR project: "warp_core_desktop") AND status: FAILEDWe perform aggregation by scenario name, and apply a given threshold on the unique count of base URLs to determine the number of different preview machines on which the failures are occurring. Since the base URL is tied to the PR/branch name, it provides an easy way to identify whether the failure is specific to a particular branch or widespread.
In case the query condition is met, an alert notification is sent as a Slack message, containing indications about the failing test(s) and quick links to the more detailed Kibana dashboard.
Conclusion
As we iterated over our original approach to test results reporting and monitoring that keeps relying on Kafka and the ELK stack, we managed to drastically increase trust in test automation by providing extensive feedback within quick reach, also adding Grafana alerting capabilities to the mix. At the same time, the cloud test reports storage project proved to be a valuable resource for other teams that adopted it, as it is not tied to specific test types, test frameworks, or reporting tools used.
For additional details about the Cluecumber reporting plugin you can check a previous article on our blog.

Follow us on