This article is written for individuals in data science or analytics roles who are familiar with terms such as confidence interval, databases, or workflows. It is aimed at those who need to implement anomaly detection techniques for various types of users with different needs. In this article, I will share my experience from working at trivago, with a specific focus on internet traffic. Rather than delving into the details of mathematical models (as there are already many well-covered articles on this topic), I aim to provide insights into real-world situations encompassing a wide range of business needs. These situations require tailored solutions to cater to different types of stakeholders.
Anomaly detection involves examining specific data points and identifying rare occurrences that appear suspicious because they deviate from the established pattern of behaviour.
In this article, the term “partner” refers to websites such as agoda.com, expedia.com, bookings.com, or others whose ratings can be found on the trivago webpage. trivago has numerous partners, each with diverse website technologies, target audiences (ranging from hostels to luxury hotels or focusing on specific countries like Germany or the USA), varying sizes in terms of the number of hotels and visits, different business models, and different goals (such as making profit or growing). This article specifically focuses on anomaly detection at the partner level.
The definition of anomaly detection mentioned above is simple and easy to understand. However, in a highly dynamic environment like trivago, where we make daily changes to improve our product through different teams and adapt our business model, we receive revenue from partners that have multiple levels of parameters. These parameters can change dynamically, either online or through predefined steps. Consequently, we frequently encounter abrupt jumps in our time series data that may initially raise suspicion. However, upon closer examination, we often discover that these sudden changes are a result of variations in input parameters, and the observed outcomes are expected, even if they were initially counterintuitive. A prime example is the amount of traffic (number of users delivered from trivago to our partners) shifting from one partner to others due to changes in input parameters or landing page quality. Such changes can lead to a decrease in traffic for one partner and an increase for another.
When examining time series data at the partner level, several jumps (either intuitive or less intuitive) may be observed. However, these jumps likely have no impact on the total traffic (the sum of traffic to all partners).
Mathematical Models
There are various models available for anomaly detection. In this article, I discuss a time series model used to predict expected traffic based on past data (which serves as the training data). The predicted traffic is typically represented as a confidence interval, with the confidence level as an input parameter that can be individually chosen for different metrics. Subsequently, we compare the actual results with the expected values, and if the difference exceeds a certain threshold (outside the confidence interval), we identify and report it as an anomaly. To facilitate reporting and enhance comprehension, it is crucial to utilize appropriate tools for reporting, such as email or Slack messages, as well as visualization techniques to effectively display the time series data and highlight the detected anomalies. These visualizations play a vital role in making the output easily understandable. To provide a few examples: We currently use the prophet model, developed by meta, in production and it has been performing well. We have also achieved similar results using “ARIMA+” developed by google. Elastic also offers several options. This article does not aim to explain the details of these models. Instead, it focuses on real-world experiences with these models and our processes. Although the solution from elastic was user-friendly and provided integrated visualization and additional information, we did not utilize it due to the lack of easy customization (but in your case it can be different).
Real-Life Cases
Data Outages
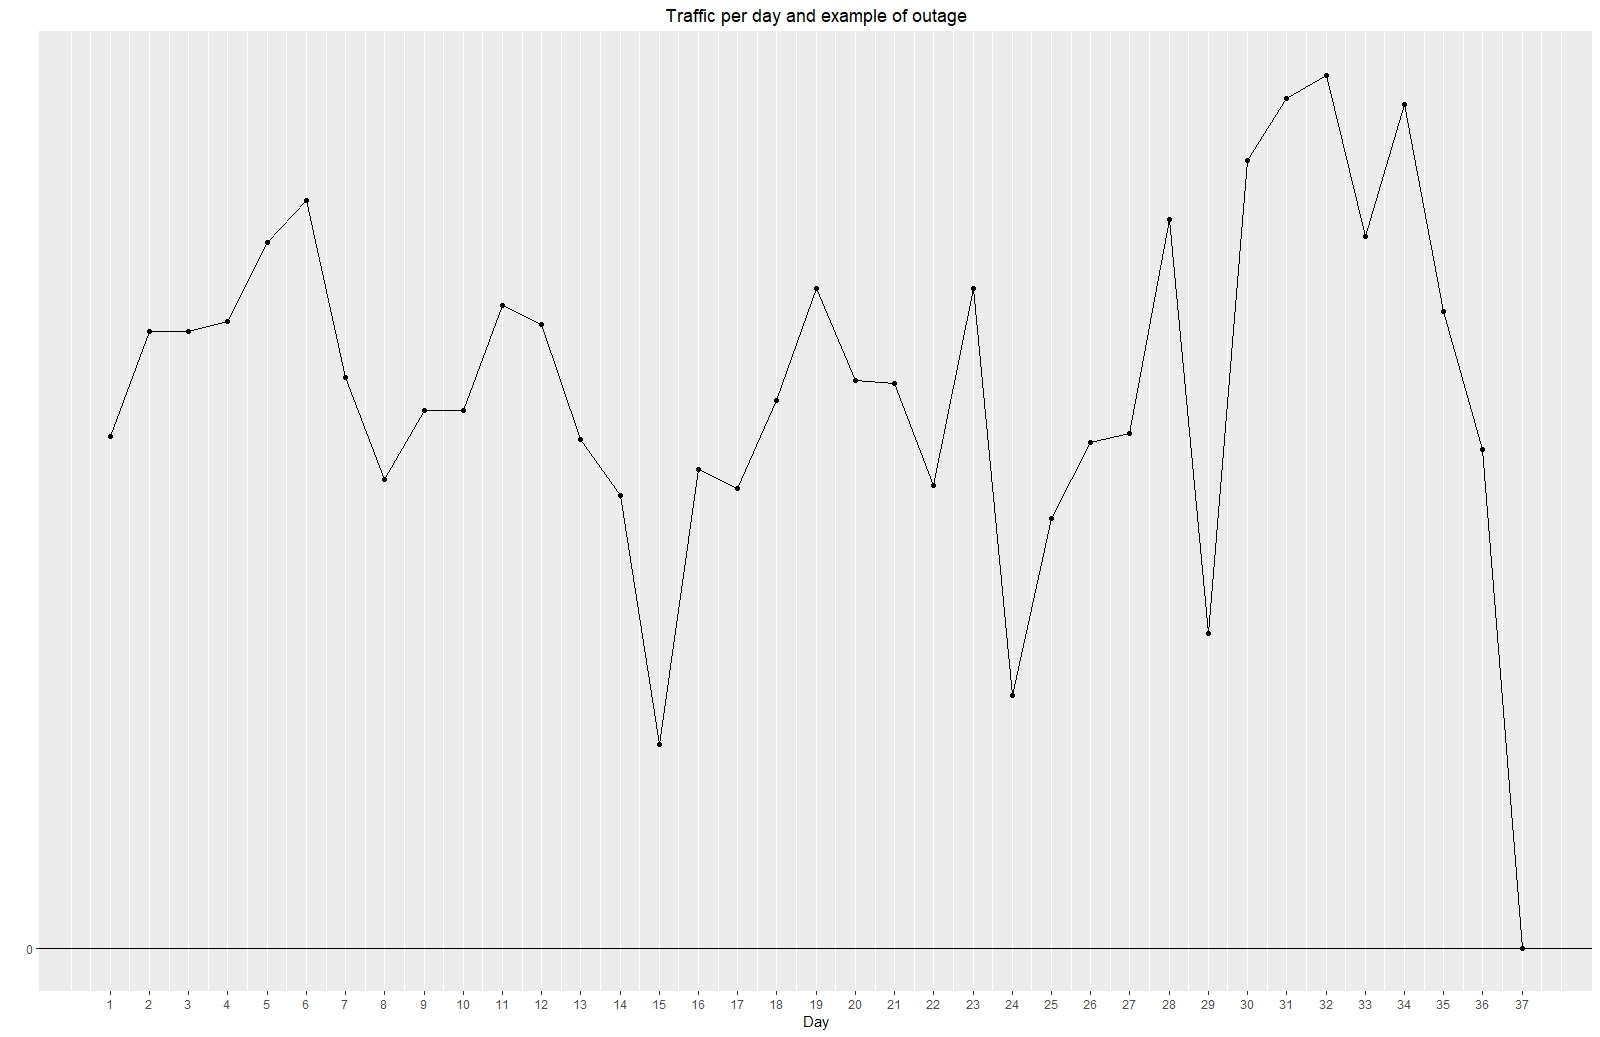
After years of using anomaly detection, one of the most common issues we encounter is data outages from some partners. With several hundred partners, various factors can occasionally cause data outages (see picture). Outages represent a typical scenario for anomaly detection. For such situations, we customize our solutions to promptly deliver information about the outage to the responsible team.

Hotel Hype and First Page of Google
Another interesting case involves anomalies that are not detected. Typically, these anomalies occur at the partner, hotel, and locale levels (under locale we understand different top-level domains – trivago.de vs. trivago.at for example). With billions of possible combinations, running anomaly detection over such a vast number of time series is impractical. Regardless of the chosen settings, the number of false positive results (meaning there was nothing suspicious, and the anomaly resulted from good or bad luck) becomes too high for my colleagues to manually check. Even advanced machine learning solutions have not been helpful.
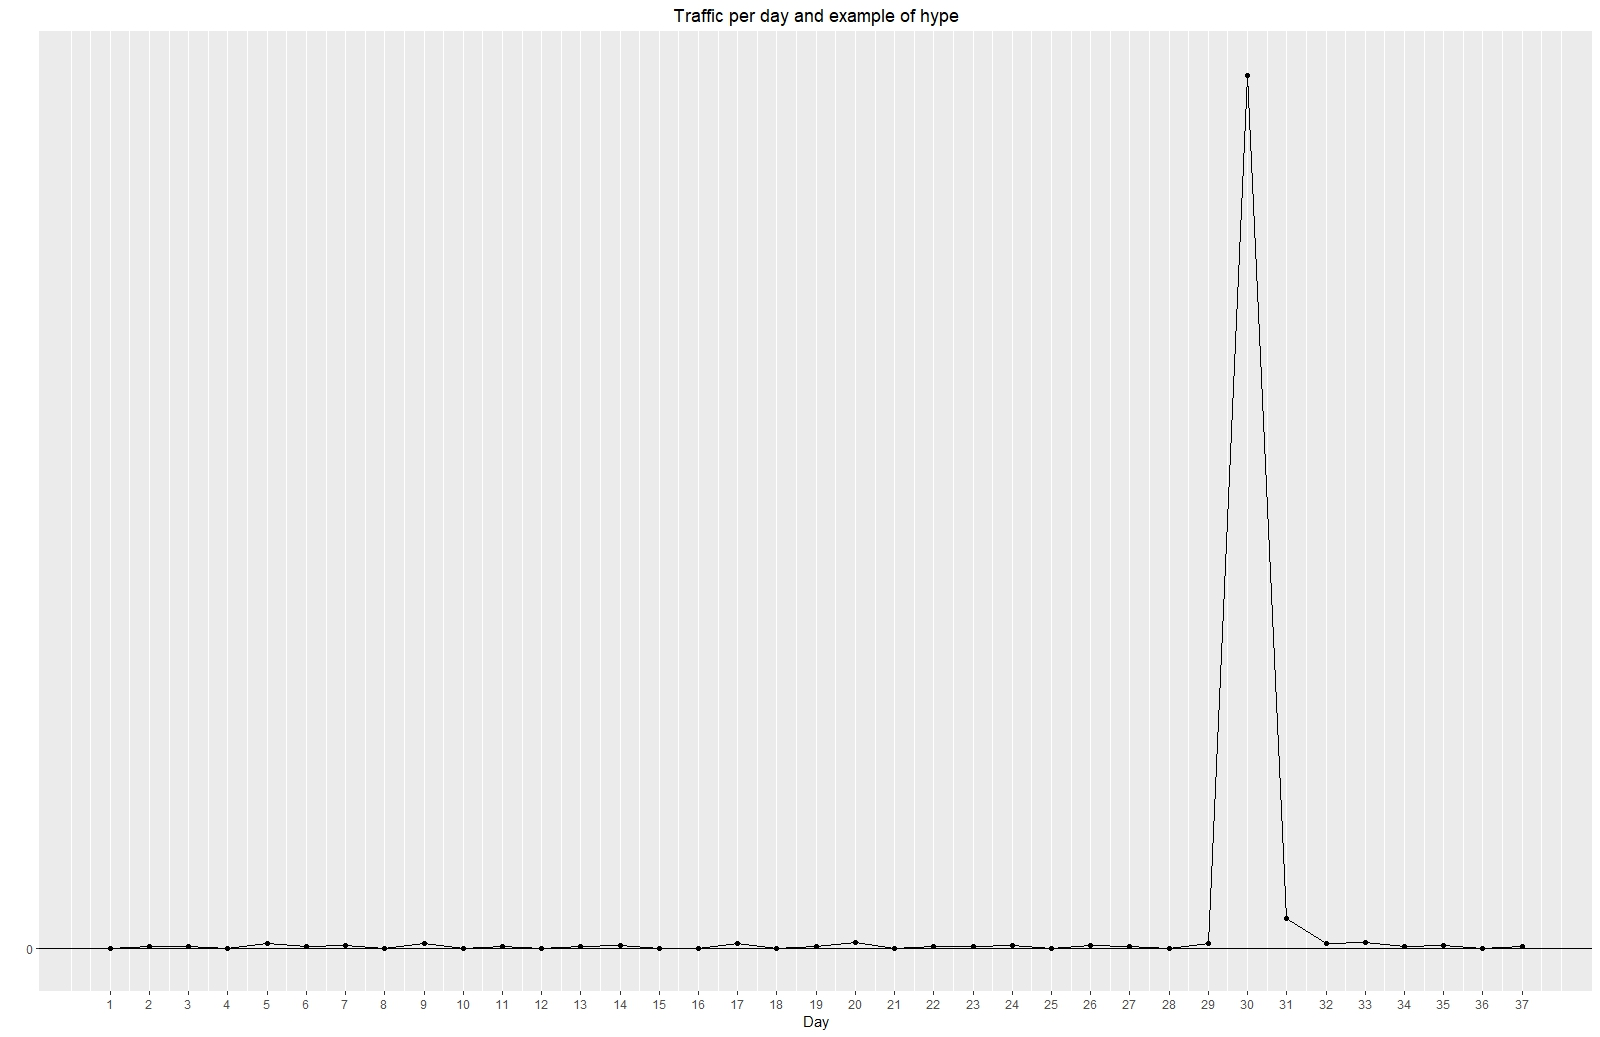
So, how can we obtain information about such anomalies? Typically, we receive occasional external reports from our partners who observe a significant one-time surge in traffic for a specific hotel in a particular country, and trivago is identified as the sole source of this increase. This situation raises suspicion for our partners as they are unable to explain the anomaly, prompting them to reach out to us for clarification. And we find the reason.
A common scenario for such cases is when a specific hotel experiences an increase in traffic from search engine (SEO or SEM) due to a rare event. For instance, if the hotel is featured on a popular TV show, it garners significant attention. People search for the hotel on Google, which displays relevant SEM ads from trivago. As a result, many users visit trivago and subsequently go to the partner’s website. We have encountered several instances of this nature. We have been able to explain the situation (with proof from Google trends for specific search term). Being on the first page of Google has a substantial impact. Especially if our partner is not on the first page.

Small and Large Partners
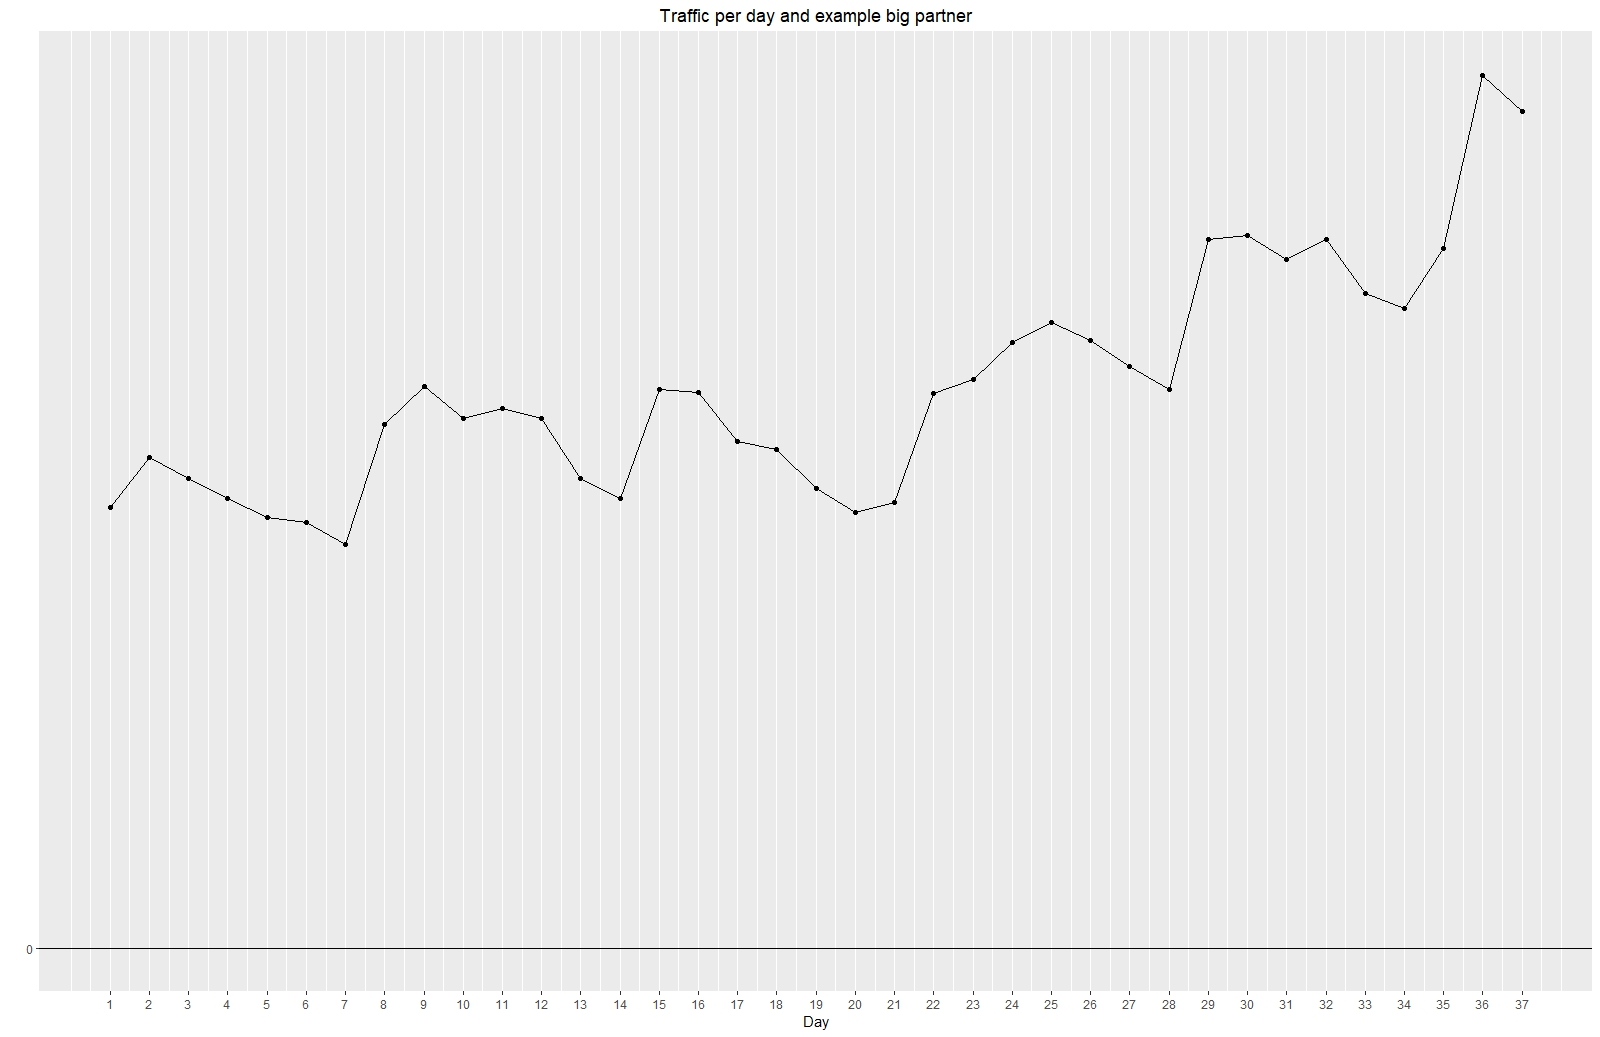
As mentioned earlier, we have hundreds of partners, each with unique characteristics and requirements. This uniqueness also affects anomaly detection. For larger partners, we often monitor results in real-time or close to real-time, sending direct warning messages to the responsible team if anything suspicious occurs. These partners typically provide good data, including long time series with numerous data points, enabling us to predict expected traffic and revenue with relative ease. Issues with these partners can have a significant impact on trivago. Consequently, we have implemented 24/7 monitoring tools to keep track of their performance. This level of monitoring is possible due to the abundance of data and our extensive experiences with these partners.

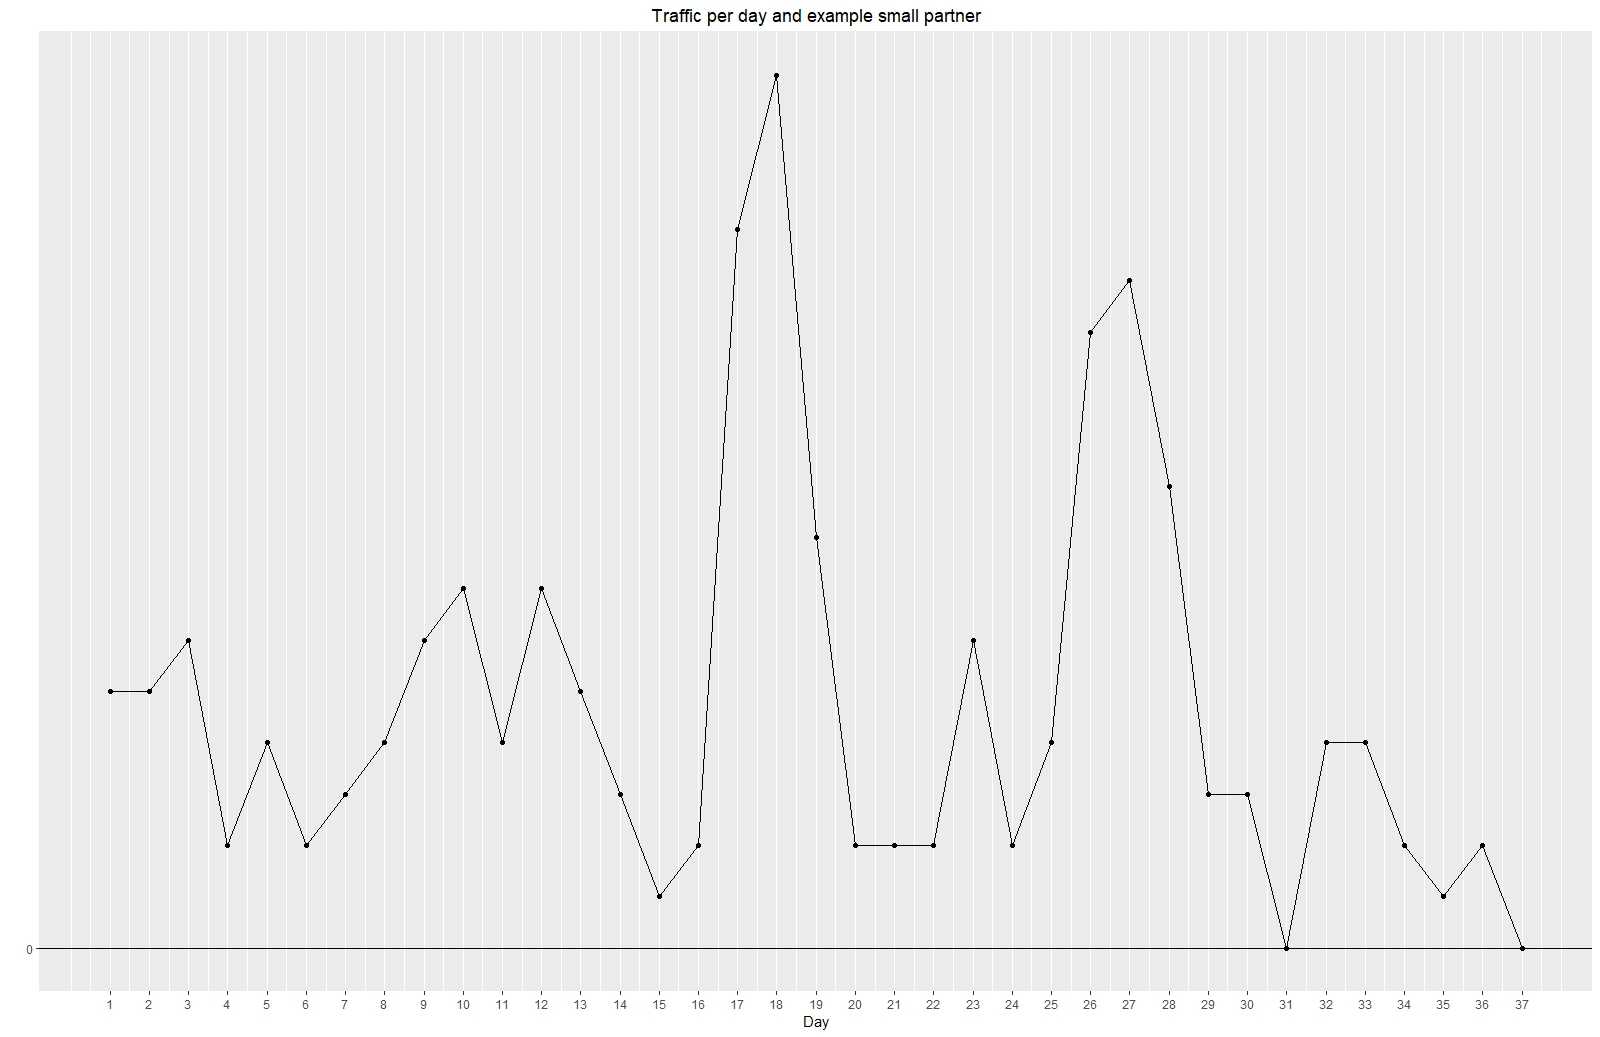
However, we also work with smaller or newer partners, such as startups, who frequently make rapid changes to their products compared to larger partners. For these partners, our time series data is much shorter, and there is greater deviation (see picture), making it challenging to accurately predict expected traffic and revenue. In the other words, data input for anomaly detection is not good enough. Nevertheless, these partners play a vital role in our business, and their significance to our users is even greater. Therefore, we need to include them in our anomaly detection efforts. These partners often send us data more frequently but with delays (detectable through anomaly detection) or multiple times (also detectable through anomaly detection). For such cases, a 24/7 solution is not practical. Instead, we have implemented various processes tailored to small partners. These processes involve providing customized support and generating reports automatically once we have accumulated sufficient data per partner. The time step for analysis is not fixed (such as minutes, hours, or days) but dynamically defined for each individual small partner. Based on the observations from those reports, we make decisions about the next steps individually per partner (there are not too many small partners who meet all conditions) to achieve better cooperation (and especially more accurate data). This approach deviates significantly from the mathematical definition of anomaly detection and is more aligned with partner care work. It requires close cooperation with other teams within trivago and beyond the realm of data science, as well as with our partners. The direct impact of this process is improved data quality and a broader selection of rates on trivago. This aspect of data science revolves mostly around storytelling, and it is beautiful because it provides us with insights from different perspectives and enhances trust in our product both internally and externally.

Takeaways and Lessons Learned
Today, we have a wide range of tools at our disposal to implement advanced mathematical models for anomaly detection. However, the significant challenge lies in setting up and designing the steps to be taken once an anomaly is detected. Sometimes, no action is required other than labelling the anomaly as non-serious or not an anomaly. Other times, we may need to adjust our mathematical model or conduct in-depth investigations outside our databases to understand the root cause and establish future processes. The development of anomaly detection at trivago is an ongoing process that continually adapts to new business and technical changes. It is never truly complete. I find this process intriguing and enjoyable.

Follow us on