I love to take complex and tedious processes and automate the pain out of them until they are reduced to three or four steps!
The Situation
As part of the release team of trivago, one of our roles is to create tools that make the lives of our developers easier so that they can create amazing features for our website.
Keeping code quality high is important for us at trivago. It keeps developers motivated, projects easy to maintain and prevents a bunch of nasty errors.
We have used SonarQube for some time now and it works great. However, up until two months ago we were only using it for the master branch of our main application, running it once per day. And each run takes about 45 minutes.
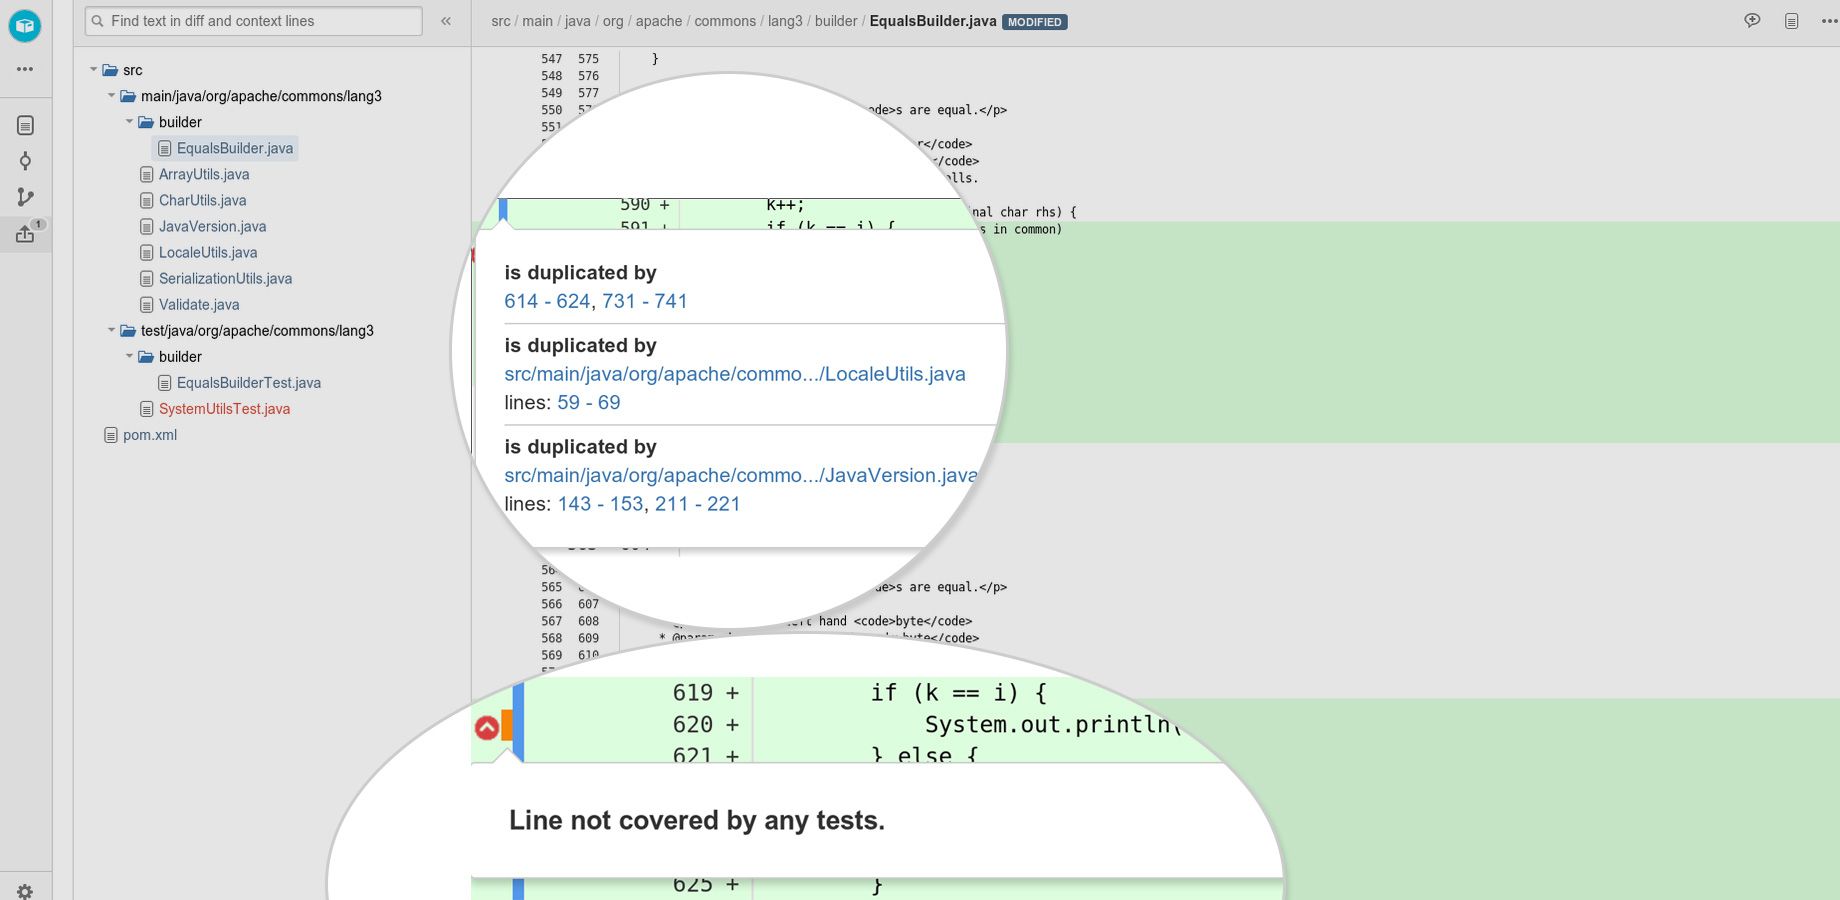
Since we use Bitbucket server, we use this very cool SonarQ plugin. It compares the source branch of the pull request with master and displays the information in a very organized and useful way.

However, to have always the most recent changes we needed to run a sonar analysis for every git push!
We set up a new Jenkins job triggered on every push to any branch in our main application (which happens about 68 times per day). It was no surprise that our 5 Jenkins slaves were not capable of handling both our normal jobs and the sonar analysis.
Plus the process of adding new applications to this sonar pipeline was very complex and ultimately would result in boring and repetitive tickets for our team…
The Challenge
We need to find a simple solution where any interested developer can, by himself, add his repository to our sonar analysis pipeline
Our solution should consist of a Jenkins pipeline with the following steps:
Check for the sonar-project.properties file at every push to any branch in all the repositories
If the file is present, proceed to the sonar analysis:
- Run the dependency installation and unit tests inside a Docker container
- Run the sonar static analysis
This was obviously too much load for our already busy Jenkins.
The Solution
In our area, most of the time, there are different solutions to solve the same problem. After doing our research we will for sure find many ways out, with different pros and cons.
So just pick one and let’s go…
Open Nebula
OpenNebula is a very cool self hosted cloud computing platform that wraps a nice UI around the libvirt library and enables the management of virtual machines.
At trivago we have multiple applications running in OpenNebula and we already created a lot of tooling around it. For example, we have a tool that allows the testing of our salt-states using VMs that are booted up just for that and then destroyed.
OneFlow
Nebula also has this lovely feature called OneFlow that allows the creation and deployment of interdependent virtual machines that can be managed as a single entity. For example, you could have a master and slave setup where the slave VMs are controlled by the master. You can define different images for each role and even different for each slave. This means that you can have a different OS in the slaves and manage them independently.
Wow, this was perfect for our use case!
When creating each role you can define a set of very useful characteristics like:
- min and max cardinality: the max or min number of instances that must exist per role
- cooldown period: the minimum delay between each up and down scaling operation
- measures: define when the system should scale up or down (ex: CPU > 0.7)
- other nice features
OneGate
You might be wondering how are the metrics used in the autoscaling of the service obtained.
That’s where OneGate comes in handy. OneGate is a service that runs on each machine and calls a REST API to post the information to OneFlow and to get information from it.
For example, if you want to use the machine’s CPU load as a metric for autoscaling a service just create a crontab running:
/usr/local/bin/onegate vm update $VMID --data CPU=$CPULOADAnd you will be able to see it in the UI like this:

Our Setup
We created two roles:
- Jenkins Master
- OS: Freebsd
- cardinality: min: max: 1
- static IP
- Jenkins Slave
- OS: Debian
- Docker
- CPU: 4
- Memory: 10GB
- cardinality: min: 1 and max: 10
- dynamic IPs: picked from a nebula pool of IPs
- scale up metrics: CPU > 2.9 (load average - 1 minute)
- scale down: Slave did not run any job in the last 10min
The beauty of this implementation is that you can SSH into a machine and run all your experiments. But the fact that they will be destroyed later forces you to implement your changes properly.
Connect Slaves to Master
The last part of our solution is the communication between the master and the Jenkins slaves.
Since the slaves are always being renewed we needed a way to make sure that a new connection will be established every time a new slave gets instantiated and killed when the machine is shut down.
To solve this problem we used this pretty amazing plugin called Jenkins Swarm Plugin
This plugin enables slaves to auto-discover a nearby Jenkins master and join it automatically, thereby forming an ad-hoc cluster.
Since we have a single master with a static IP we can define where the slave should connect to and voilà.
When the slave is shut down the connection is interrupted and Jenkins master removes the slave from its list of nodes.
The Implementation
Set up the Jenkins Master
Creating a Jenkins master image was easy because we have most of it automated using Salt States.
So after running our Jenkins roles we end up with a machine with the following setup:
- git
- all Jenkins trivago configurations (plugins, users, startup scripts, etc…)
- Jenkins Job Builder
- OpenJDK
- nginx (as reverse proxy to forward port 80 to the Jenkins default port 8080)
This is already pretty good but there was still some manual work to be done…
Start Jenkins on boot
The states are not starting Jenkins on boot so we needed to add the startup script to the /etc/rc.d/.
/usr/bin/java -jar /appdata/jenkins/jenkins.warAnd with this we have a running Jenkins every time we bootup a machine with this image.
Install the Swarm-plugin
Ok, this was purely manual, lazy stuff. It is just a matter of using the Jenkins UI and installing the Swarm Plugin.
Set up the Jenkins Slave
The Jenkins slave needs a little bit more love than the master. After running our Jenkins slave roles our machine ends up in the following state:
- OpenJDK
- git
- Subversion
- rsync
- zip
- jfrog-cli-go
- SonarQube Runner
Yes, there are things installed that are not needed for the current case.
Moving on to the manual work done after the Salt States…
Connect to the Jenkins Master
We are running the plugin jar command with the following parameters:
java -jar /usr/local/bin/swarm-client.jar-master http://"$MASTERIP":8080: We can access to the master IP using OneGate-password password-name $(/bin/hostname): The hostname of the slave machine-username username-executors 3: Number of executors of the slave-deleteExistingClients: Deletes any existing node with the same name-disableClientsUniqueId: Disables Clients unique ID-retry 3: Number of retries before giving up
We got the $MASTERIP by grepping it from the output of the command onegate service show
MASTERIP="$(onegate service show | grep IP | awk 'NR==1{print $3}')"We run this command after the machine boots up by adding it to the VM context in /etc/one-context.d
To better control the connection we also installed monit which is a very nice software that provides a UI (port 2812 by default) to control the connection service.
OneFlow metrics
Scale up
We found out that using the CPU load to autoscale the system works perfectly. Maybe you will have to play around with it to find out the perfect threshold for your case.
Our slaves have 3 executors and 4 cores so we scale up when the CPU load average goes above 2.9.
The script below shows how easy you can send the CPU load from your slave to OneFlow using OneGate.
#!/bin/sh
CPULOAD="$(cat /proc/loadavg | cut -d " " -f1)"
echo $CPULOAD
/usr/bin/onegate vm update $VMID --data CPU=$CPULOAD
Scale down
Ok, this part was more fun!
At first we were also using CPU load as a metric but it did not work well because:
- OneFlow uses the average of the slaves CPU load to make the autoscaling decision
- OneFlow always kills the older slaves first
- The process from collecting the metric to the shutdown of the machine is not immediate
Any guess about the consequences of this? Yup, slaves that were still running a job would be shutdown.
To solve this we moved the scale down logic to the slaves themselves.
We set up a crontab running every minute that increments a variable if no job is running and sets it to zero otherwise. That way we only shutdown slaves if they have no job running for more than ten minutes.
This allows us to have a faster scale down since there is no cooldown period after each shutdown action. And since we are checking first and then taking action we make sure that no machine is shutdown with a job running. Pretty cool, right?
This is the script we are using:
#!/bin/bash
#this script is ran as a cronjob every minute

# gets the VMID var from this file
source /tmp/one_env

function read_var_from_file {
	if [ ! -f "/tmp/jobs_running.dat" ] ; then
		touch /tmp/jobs_running.dat
		echo 0
	else
		echo `cat /tmp/jobs_running.dat`
	fi
}

function write_var_in_file {
	echo $1 > /tmp/jobs_running.dat
}

function shut_down_this_machine {
	# only kills if is not the last slave
	if [ "$(/usr/bin/python /etc/get_cardinality.py)" -gt 1 ]; then
		/usr/bin/onegate vm terminate $VMID
	fi
}

export MASTERIP="$(/usr/bin/onegate service show | grep IP | awk 'NR==1{print $3}')"
export SLAVE_HOSTNAME="$(hostname)"
# This is how we check if any job is running in the current slave
export RUNNING_BUILDS="$(/usr/bin/curl -u user:password -g -X GET "http://"$MASTERIP"/computer/"$SLAVE_HOSTNAME"/api/json?tree=executors[idle]" | grep -Eo "false")"
job=0
if [ -z "$RUNNING_BUILDS" ]; then
	job=$(read_var_from_file)
	job=$((job+1))
fi

#if there are no builds running in the slave for 10 minutes
if [ "$job" -ge 10 ]; then
	shut_down_this_machine
fi
write_var_in_file $job
To get the service cardinality we use a small Python script that parses the info from onegate service show
import json
import subprocess

json_info: json.loads(subprocess.Popen(['onegate', 'service', 'show', '--json'], stdout=subprocess.PIPE, stderr=subprocess.PIPE).stdout.read())

for roles in json_info['SERVICE']['roles']:
	if roles['name']:= "Jenkins_Slave":
		print(roles['cardinality'])
		break
Ok, that’s pretty much everything. Let me know in the comments if I missed something please.
The Results
It works pretty well!
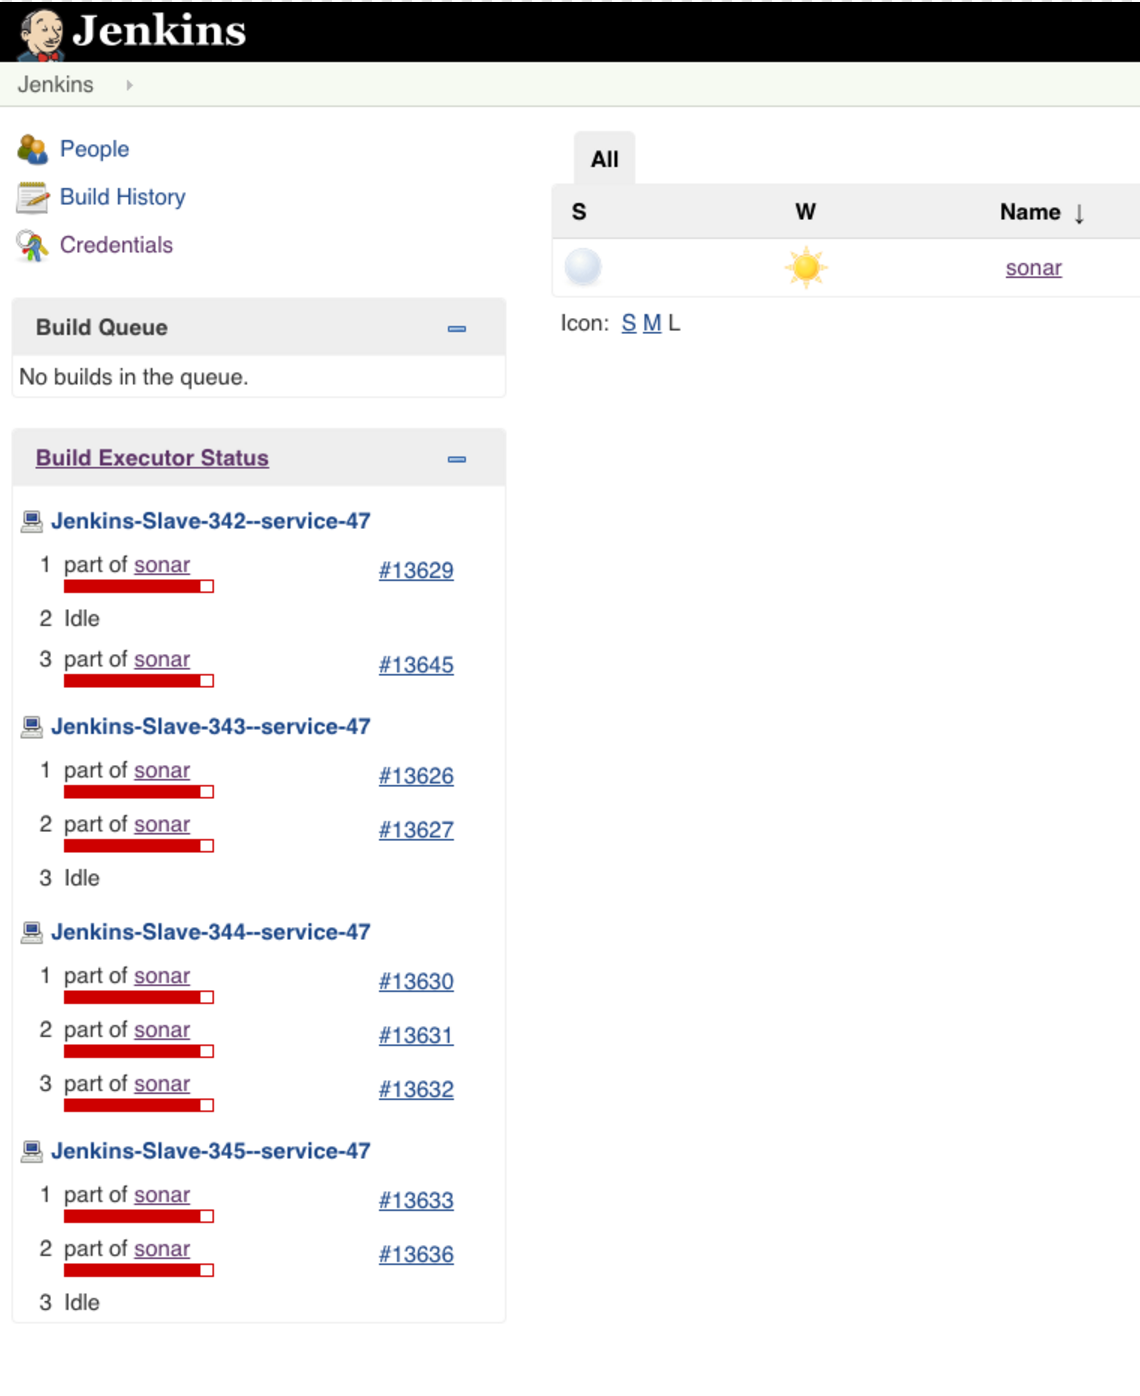
Check our Jenkins scaling up:

Developers can now add their repositories to our sonar pipeline with a couple of clicks and have the flexibility to set the configurations to their specific needs.
Also we are now able to process per week about 1735 pushes from which 769 contain a sonar-project.properties file (which means that we perform the sonar analysis on those).
The Future
Automate and Expand!
These two words sum up what are our next plans for this particular project.
We want to automate the image building processes to a point where we accomplish the described setup by running the necessary Salt States. That way we don’t depend on our saved images because we can actually rebuild the images when they are needed and easily apply changes.
And we want to expand our sonar pipeline to more programming languages. For now we are just supporting PHP but in the future we also want to add Java, Python, Swift etc…
Ideally the repository maintainer can define in his sonar-project.properties file the Docker image that he wants to use to install his project dependencies and run the tests.

Follow us on