The Situation
At trivago, we use a Cucumber based framework for end-to-end tests of our most important web applications. Cucumber stores test result as JSON files which can be turned into human-readable test reports.
Up until now we used the widespread cucumber-reporting Maven plugin.
This was a good choice at first because it supported the generation of reports from multiple JSON files - we have this situation since we use the Cucable Maven plugin to parallelize our test runs.
The Problem
During our experience with the current reporting plugin, we faced some issues that made us think about coming up with a custom solution:
- It showed a lot of numbers and statistics we did not really need.
- Test failures were not shown prominently enough.
- It considered intentionally skipped scenarios as failed resulting in a lot of false negatives.
- It only showed feature names on its start page - that meant we had to click on each failure to find out which scenario belonging to a feature actually failed.
- It would consume a lot of memory at times, especially with large JSON report files with a lot of included attachments.
- It generated a large portion of the report HTML hidden inside Java classes making it complex to modify the look and feel of reports.
The Idea
During an internal trivago hackathon, I decided to have a shot at creating a new report plugin that would solve all of those issues. After some research, I stumbled about Apache’s freemarker template engine - the perfect solution for our use case. It allows to use ordinary HTML templates with placeholders for a passed in Java class and generates static pages from it. Since I was already familiar with JSF development, it was a natural choice.
So the basic flow would be:
- Deserialize all Cucumber JSON files and strip out all attachments during this process.
- Combine all necessary data into one reporting source.
- Copy all static resources like Javascript, CSS and images to the report target directory.
- Generate a start page containing the most important test suite overview statistics.
- Generate detail pages for each scenario containing additional information.
In a nutshell, this is the basic process:
Once the technology decisions were made, it was surprisingly straightforward to develop a first prototype that eventually evolved into the first official release.
The Solution
The new Cluecumber Report Plugin generates a start page that shows statistics for the whole test suite such as
- Number of passed, failed and skipped scenarios
- A test result diagram
- Grouped searchable tables for each status containing all feature and scenario names
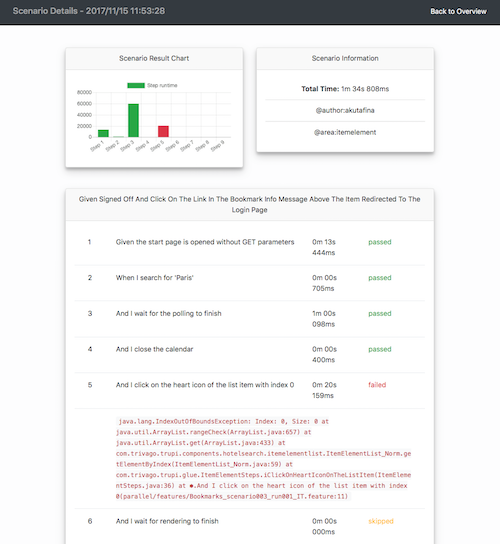
For each scenario, a detail page is generated that includes
- Scenario name and description
- Total runtime
- Scenario tags
- A chart showing each step status and runtime
- A list of steps containing status, failure stacktrace and screenshots
Summary
Since using the Cluecumber Report Plugin in our test pipeline, the analysis of end-to-end test results is more straightforward than before.
In the future, we will extend this plugin even more. One idea is to also allow users to use their custom report templates - something that is not possible with the established reporting solutions.
If you want to check out or contribute to the Cluecumber Report Plugin project, just head over to our Github repository.


Follow us on