
Moving to Microservices for Monitoring Content Delivery Networks
Intro
Back in April 2015, I felt the need to do some work and earn money besides my studies in Computer Science at the University of Düsseldorf. After doing some research and crawling a few job platforms, I finally applied for a job in IT-Support at trivago. The job offer looked very appealing and life at trivago promised to be fun.
After two years of diverse work for IT-Support, including hardware and software setups as well as setting up servers and writing some Bash and PowerShell scripts, I had to start thinking about my upcoming bachelor thesis, as the end of my studies came closer. Of course, life and work at trivago soon convinced me to stay, which is why I quickly contacted several people in the company to ask for possible topic proposals for my bachelor thesis. This is when I met Xoan and the Website-Performance team, who offered me the following topic for my thesis:
Refactoring a Monolith into Microservices - An Engineering-Driven Approach
So, what is this about? Some work in the Performance Engineering team is done to provide useful dashboards and metrics to monitor the performance of the trivago websites and other internal tools. Several Content Delivery Networks are serving the trivago to people all around the world. But is their service reliable and is the web-service performing well on their servers? This is a small part of the metrics that currently are fetched by a monolithic application written in PHP which is responsible for all the CDNs as well as for some other services that provide useful metrics.
So my task for the practical part of the thesis was to examine the structure and “workflow” of the existing monolith and extract some services that are only responsible for a single monitored API. Also, we decided to write the new microservices in a programming language that we thought would be more suitable for this kind of work: Go.
As my preliminary knowledge in the microservice architecture as well as in Go- and PHP-Programming boiled down to basically knowing what they are, but nothing else, my first month of working on this project consisted of reading several blog posts, scientific papers and tutorials as well as watching tons of YouTube videos and conference talks.
When I first started to examine the legacy code, I felt quite lost in that code-base with lots of dependencies between modules and big frameworks and platforms like Symfony and Orchestra. To be fair: I never worked with those tools let alone PHP at all.
So my first approach was to generate a PHP class diagram to be able to draw borders between all those single modules and processes.
See, what the monolith looked like:
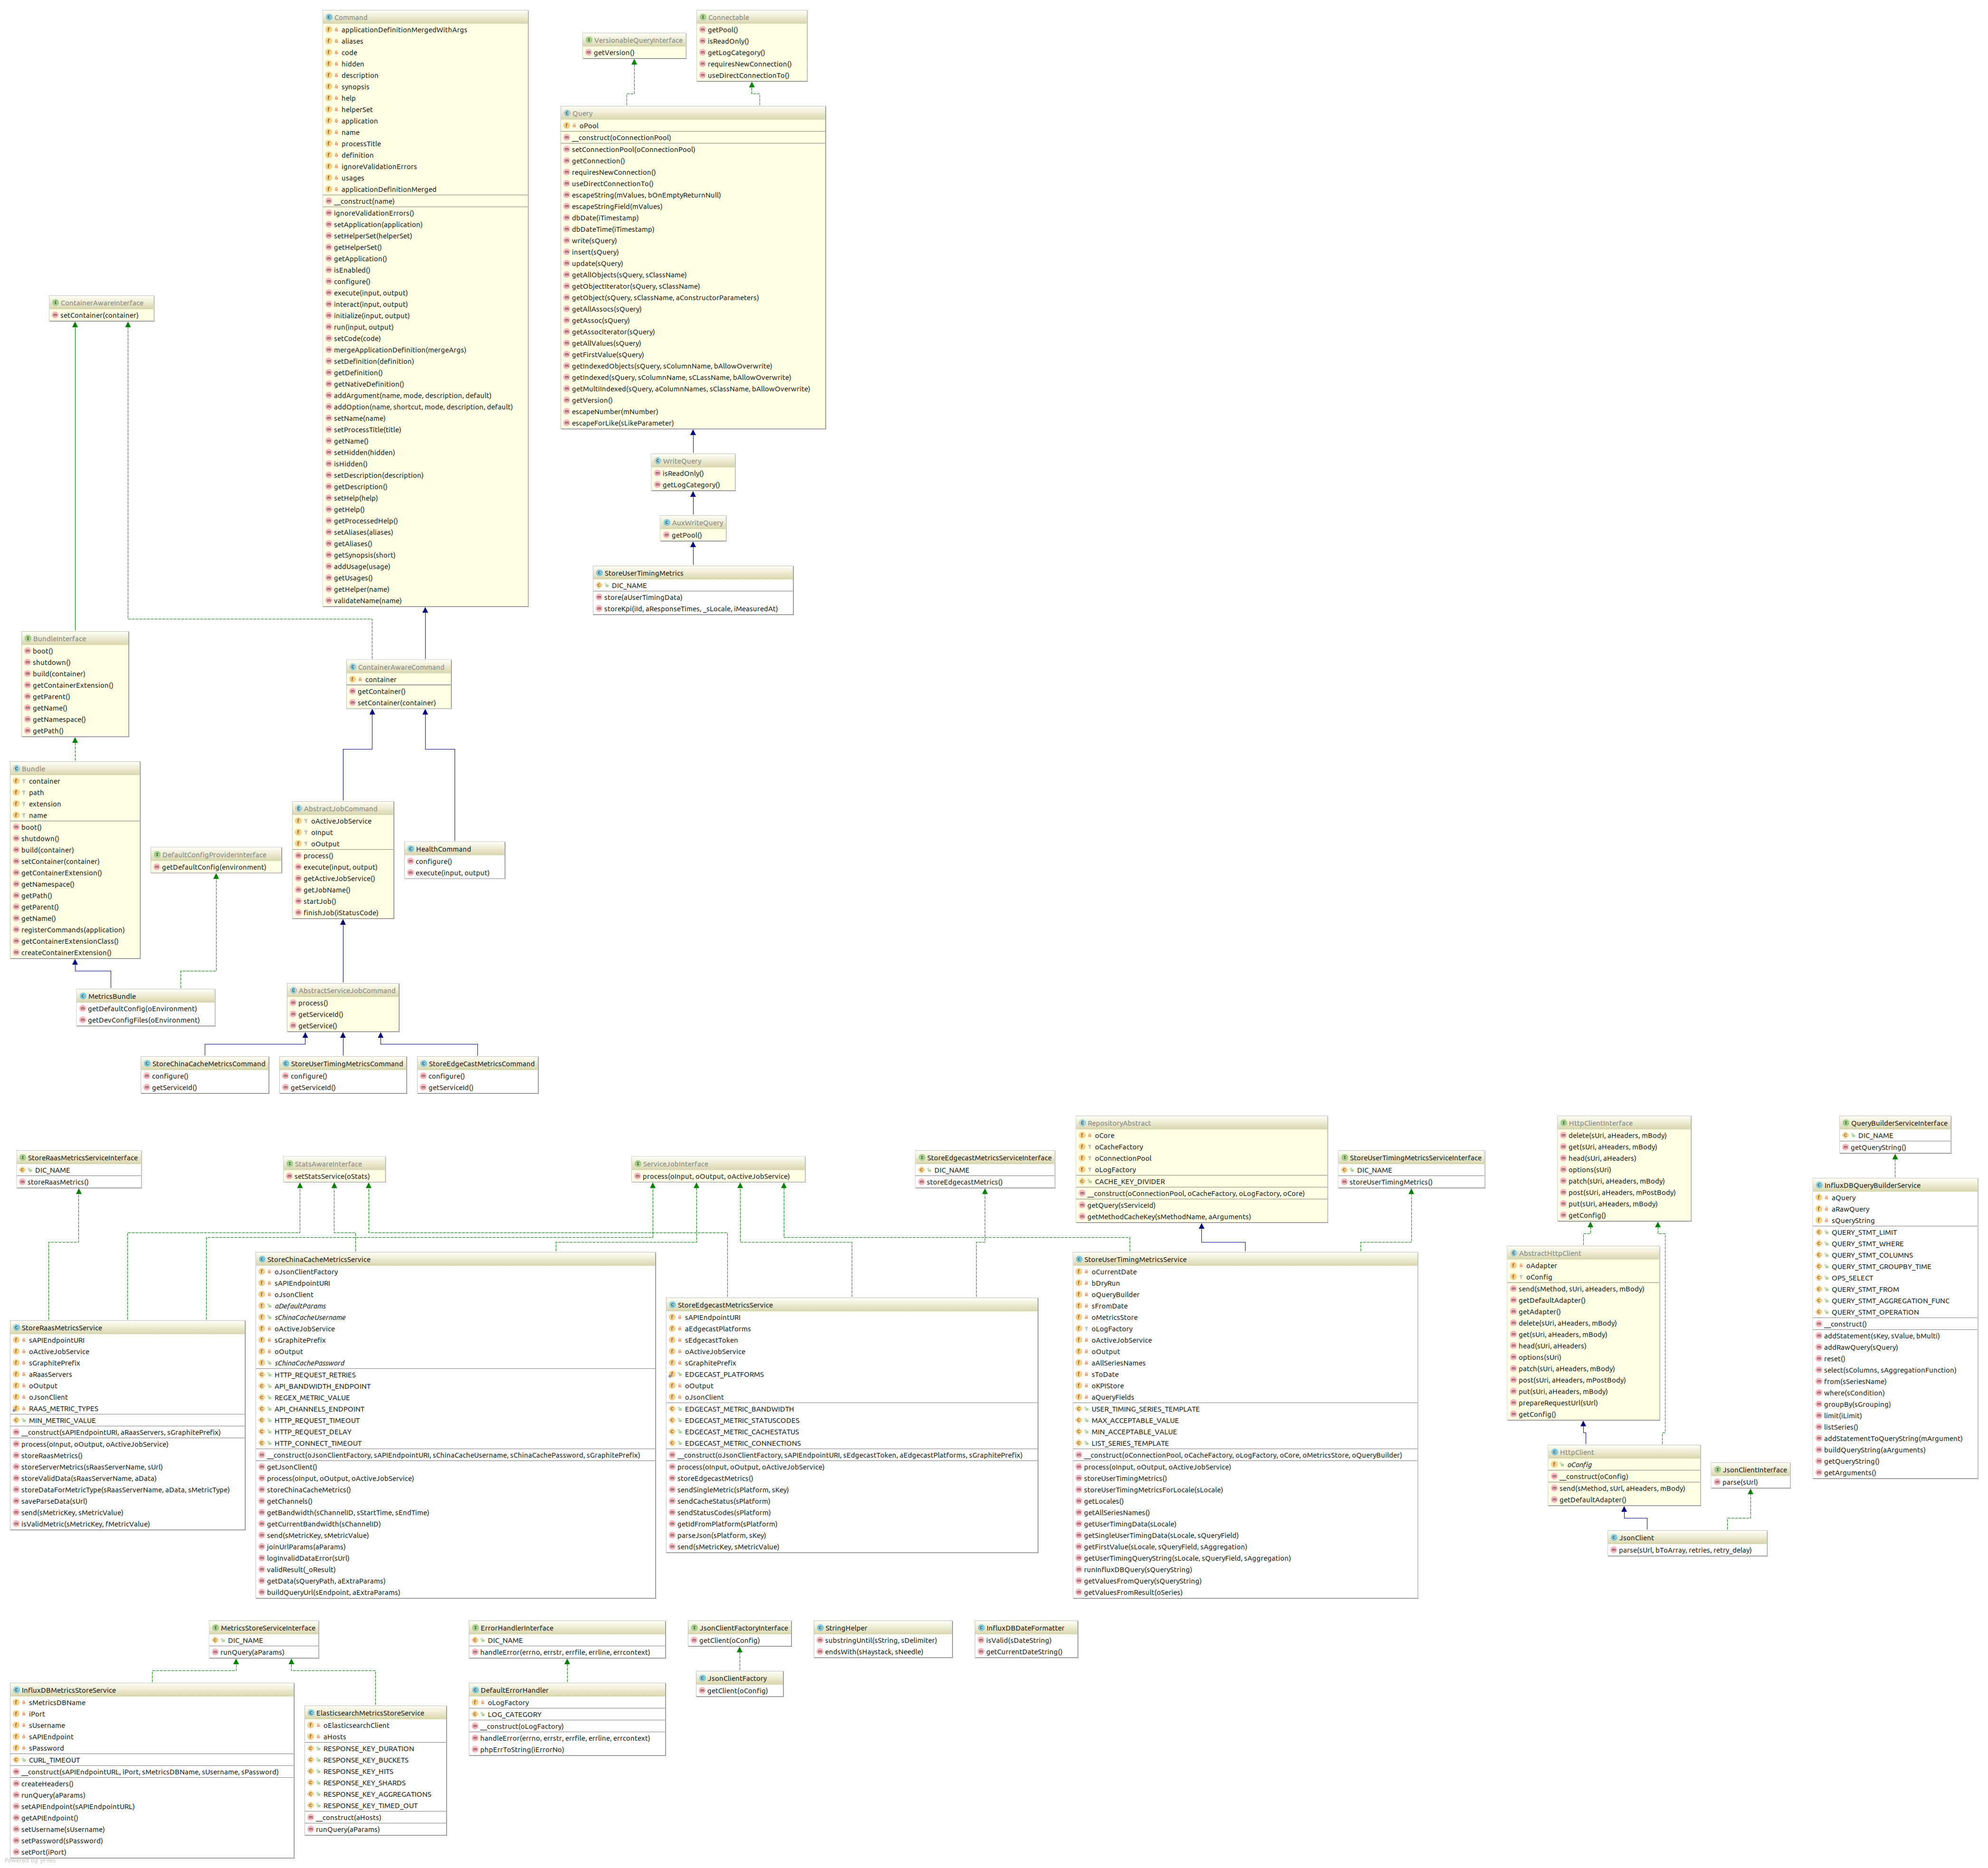
Looks nice, doesn’t it?
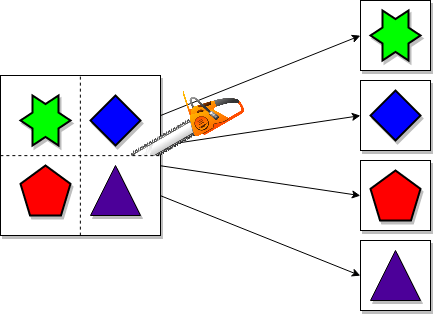
I proceeded by choosing the two modules responsible for fetching metrics from the APIs of ChinaCache and Edgecast (owned by Verizon) to be my first two services. OK, now I saw the target on the horizon: Extract those two modules from the monolith to stand-alone microservices written in Go.
I started off examining the functionality of the Edgecast-Service. What it did was basically:
- Execute an HTTP-GET-Request against the Edgecast CDN API to fetch pre-defined metrics.
- Parse the JSON-Response into PHP objects.
- Grab the returned Metrics-Value from the resulting Object and send it to InfluxDB as a gauge value using Graphite.
Huh, that sounds easy to implement (in terms of first “bigger” project I ever wrote in Go). Lucky enough, my mentor Matthias already created a Go-Client for querying the Edgecast API earlier, that was unused at trivago… until now.
There was only one catch: After several discussions about the currently used tools and infrastructure, we came to the conclusion that we don’t want to export the metrics to InfluxDB anymore, but rather want to use Prometheus, which seemed like a good fit for monitoring microservices. Therefore, plans changed to writing an exporter for Prometheus. So You Want to Write an Exporter? - Yep, please show me how.
As Microservice-Architecture emphasizes logging and instrumenting, I decided to apply it using middleware similar to the “Onion-Model” as it is used by the creators of go-kit, a framework to easily implement microservices in Go. You can hear something about the onion-model in Peter Bourgon’s talk at Cloud Native Con 2017. This basically meant separating the logging- and instrumenting-processes into their own files and letting the main file wrap them around the actual service, so that every function call to the service-logic would first need to go through those routines. Fair enough, go-kit also supports creating native Prometheus metrics, so using this framework, I could easily export the metrics fetched from the API to Prometheus as well as the metrics created by my own service, including request-counts and request-latencies. Using this method maybe required a bit more code, but moved every bit of auxiliary logic into separate files, which results in less code inside the service itself, which looks somewhat clearer and more readable now.
For exporting all the metrics into a format suitable for Prometheus, we decided on writing a Collector that implements Prometheus’ Collector-Interface by implementing the Describe- and Collect-Function, which provide pre-defined metrics-descriptions or newly-created metrics to a requesting service (e.g. a Prometheus Server).
Trying to stick to the premises of The Twelve Factor App, every piece of configuration is passed as environment variables. In terms of the Edgecast exporter, the configuration only consists of two environment-variables that define the Access-Token and -User-ID for the Edgecast CDN API.
It took several more discussions and decisions in different areas to come up with the final code that we now published on GitHub.
The “final” implementation now works like this:
- The service listen-and-serves on https://some-address:80/metrics using the promhttp.Handler().
- On request, the exporter uses the edgecast-client to query all the predefined metrics (see the
README) from the Edgecast CDN API. Goroutines are being used to concurrently run requests for every possible platform and metric. - The edgecast-client parses the resulting JSON-response into Go-Structs and returns them to the Collector.
- The collector reads the metrics from the fields of the returned structs and creates new metrics with the results as gauge values.
- Those metrics are then passed through a channel to the collecting function and become readable on a defined endpoint.
Note: One could either request and view the metrics by manually visiting the endpoint or having a Prometheus Server running that is configured to scrape that endpoint.

Are you now interested in this service? Cool! You might want to check out the GitHub-Repository then and check the README, browse through the code and try it out.
Now that I finished the first practical part of my thesis, I had to focus on writing the theoretical part including all preliminary knowledge including a whole introduction to the microservice-vs-monolith-discussion.
Soon I found myself in the middle of hundreds of resources that had to be examined and cited, etc.
That quickly got pretty boring exhausting and so I needed some diversion.
I then started planning the implementation of the Microservice responsible for doing the same steps as the Edgecast-Service but for the ChinaCache CDN API. That was a bit more difficult than the other one:
- The documentation is not that easy to understand (and only a mechanically translated version of the Chinese original was available).
- There was no finished client available in Go.
- ChinaCache provides more than one API, using even more variables, to get the needed metrics.
- The Connection to the ChinaCache CDN API might timeout sometimes (information from prior experiences).
The main “problem” here: as the connection might time out, no usable metric will be returned to a scraping Prometheus instance and after a while, Prometheus will eventually discard the metric completely. After doing some quick research we came up with the solution for our new problem: Simply use Prometheus’ PushGateway and push the metrics to the Prometheus Server actively when they are actually available.
The approach to doing so is actually not that much different from the one used for the Edgecast-Service, as I decided to again create a collector which results are then actively pushed to the Pushgateway using Prometheus push.AddCollectors(), instead of being passively scraped by the Server.
The benefit to using this approach: with a few small code changes, the collector can be used separately for scraping metrics. Same thing for the client.
Here’s the schema for using a Prometheus Server + Pushgateway:

So first of all, I implemented a stand-alone client that can execute HTTP-Requests against ChinaCache’s API-Endpoints to gather all the needed metrics. The client also creates structs from the JSON response. By the way: JSON-to-go is a great tool to easily generate structs in Go conforming to the structure of the returned JSON.
Contrary to the Edgecast-Service, I now tried to avoid tying in too many external dependencies and so I didn’t use go-kit here. I also decided not to use the onion-model for logging and instrumenting here, as I already realized that this might be kind of “overkill” for that service and because the minor logging-tasks, that are sufficient for this kind of service, might as well be included in the service-logic.
Besides that, the logic of the two exporters doesn’t differ too much from each other, except that the building-process of the URL used for querying the ChinaCache CDN API is a bit more complex, as the API requires one to query a specific time-interval for the metrics. Also, some metrics from ChinaCache are only available for day-crossing time-intervals, as they are only generated once per day.
Additionally to the User- and Password-Configuration, the service requires environment-variables specifying the PushGateway, the Channel-IDs that are available for the specified user and optionally a Querytime that defaults to 5 minutes.
Results
Finally, we decided to open-source these services for everyone to use and contribute:
- Exporter-Edgecast: https://github.com/trivago/exporter-edgecast
- Exporter-ChinaCache: https://github.com/trivago/exporter-chinacache
Obviously, the scraped metrics are the same as they’ve been in the old monolithic application, but by refactoring the monolith into small and independent services, we mainly fought one major problem: complexity. The codebase uses way fewer dependencies and is more readable and overseeable than the monolithic one. Also, we moved from needing several tools for collecting metrics to only one tool: Prometheus. Despite that, the new services also speed up the Requesting-Processes by firing up several goroutines to concurrently query and process metrics from the APIs. All in all, the biggest benefit of refactoring this specific monolith into a microservice architecture is the improved maintainability due to reduced complexity.
After extensive testing on my development machine using local installations of Prometheus Server, Prometheus Pushgateway, and Grafana, we were ready to release my services into the trivago infrastructure. In order to do so, I containerized the applications using Docker, created a job-configuration and deployed them via Nomad. Inside the Nomad job specification file, the environment variables used to configure the services can be specified. Also, the job specification allows setting several tags that can be used by a service discovery program. At trivago, there is already a service discovery, namely Consul, in place, which aggregates services by tags. Prometheus can then use Consul to get the addresses of services with a specific tag to be able to scrape them even though they might have changing addresses due to restarts, etc.
Here is a diagram of the production data flow:

Now that the service is up and running in the Nomad cluster and discovered by Consul, Prometheus can scrape the metrics on our pre-defined endpoint:


After all, we can now use our existing Grafana instance to utilize these results to create nice dashboards for easy monitoring:

End
That’s it, I hope you liked my first blog post ever. I would love to hear about any usages of and/or contributes to those services.
I would like to thank my thesis-supervisor and -mentor Matthias Endler who came up with this project idea, gave me lots and lots of input, and introduced me to many of the internal workflows and setups of the trivago software engineering infrastructure. Also, thanks to my team lead Xoan Vilas, who made it possible for me to write my bachelor thesis in his team.

Follow us on